BTC Corrects and Drags Alts Down, But Still Setup for Bull Run
The Recent Bitcoin Correction and What it Might Mean For Crypto
Bitcoin went into correction mode after losing some steam this weekend, it predictably took alts down with it. However, there is still a nice setup across the board if some key levels can hold. <—- that is a big “if”… “if not” then one has to reassess. Every bear market starts off with a correction and almost every bull run has corrections, it’s just is the way it is. I could make as case for either the bullish or the bearish at this point, but the focus of this page is on the setup for a recovery and further run.
NOTE: The goal here is to be educational and to illustrate how to look at charts, to understand probabilities, to make your own choices, etc… the goal is not to offer investing advice (if you want price targets, try TradingView.com or CoinTelegraph.com).
The Analysis
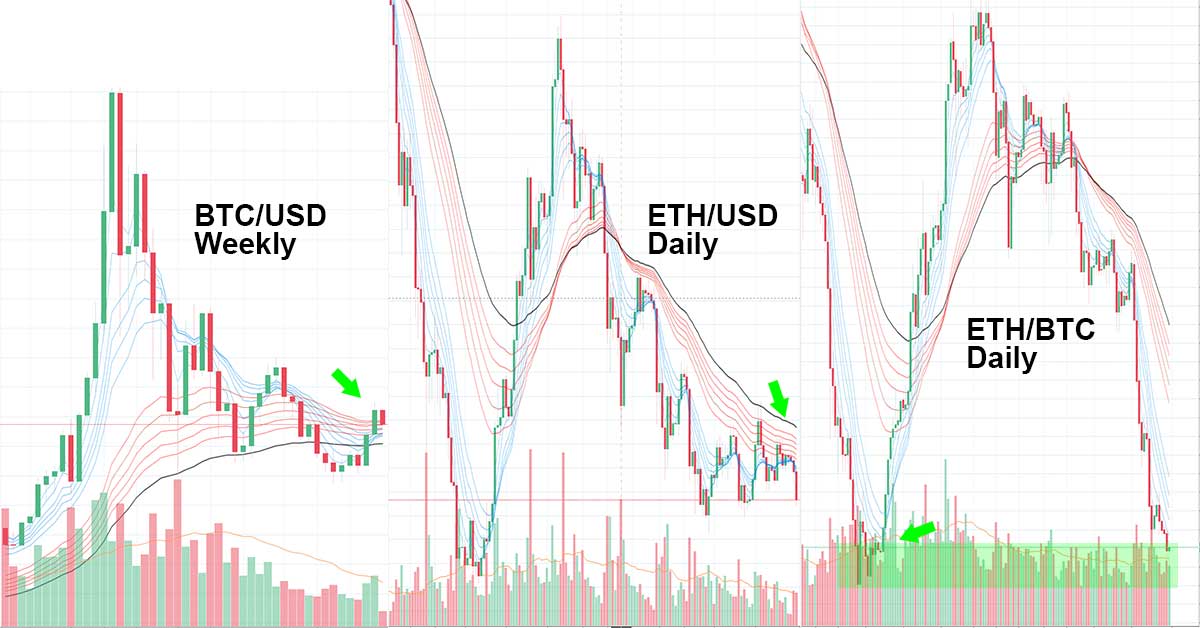
With the above covered, as you can see in the image above, Bitcoin’s price action is sitting on top of some key moving averages in terms of its weekly chart (the red lines are longer term averages, the blue lines shorter term; it’s a Guppy moving average… Google it).

The above is true for the daily chart as well where we are looking at the 12 and 26 day emas (see why those are important), see below:

That means, in short, Bitcoin is still in an uptrend and has more room to correct before dropping below its 26 day exponential moving average (the orange one the red arrow is pointing to above).
That doesn’t mean the price will correct down to there, it only means that even if it did it wouldn’t necessarily signal the start of a new downtrend (although it would make it look like a head and shoulders was forming, which wouldn’t be a great sign).
Also consider, although the chart doesn’t show it, Bitcoin’s 4hr and lower RSI is toward oversold (it was overbought previously). These are all good signs for a reversal.
Right now I’d be watching the 15 min candles for a sign of what comes next, but as you can see from a zoomed out view the correction hasn’t taken BTC out of the game yet.
Moving on, in terms of ETH, let’s look at ETH’s daily USD and BTC charts as illustrated in the header image.
At first glance they might not look super attractive, but essentially read together one can see a good setup for a breakout. On one hand ETH/BTC is sitting on its April lows in BTC. On the other hand, the ETH USD pair sees the price trapped under a number of key moving averages (from which a breakout above those would be bullish).
Although anything could happen, this setup taken as a whole (that is BTCUSD, ETHUSD, and ETHBTC) creates a potential path where Bitcoin stays above its 26 day moving average, continues to form golden crosses on its weekly chart, and lifts up ETH enough to where it starts doing the same (here the April low in ETH/BTC would hopefully act as support).
If BTC and ETH can do this, it bodes well for other alts, since many alts have this same setup essentially.
Of course there are a ton of “ifs” in there and thus far Bitcoin has pretty much been the only coin showing strength outside of one or two key coins like XLM (and that strength noticeably started fading over the weekend).
To create any sort of substantial bull run will require a bunch of moving pieces to fall into place. Thus, the reality might be that we see BTC move up another leg but not take alts with, that we see BTC fail from here and go back into the $6k range (from there we would have to reassess), or that we see some other variation.
Literally anything is possible and it is impossible to know what is going to happen next!
All we can know is what has happened so far and then we can analyze that using long standing chart analysis techniques.
In terms of BTC and moving averages on the higher time frames, what is happening is still a textbook bullish pattern. In terms of alts, it is mostly textbook bearish (especially in btc pairs for most alts), but with everything considered together, it paints a picture that shows a path out of the 2018 bear market by way of Golden Crosses. That is worth noting, but when it comes to placing bets, you’ll need to make your own choices and assess risks seriously.
NOTE: Let’s say everything works out perfectly and BTC and alts go up. Then let’s say 6 months later they go down… but you held through everything. Well, you could still end up losing money. Crypto is always risky. The only advice I’ll give is “never bet more than you can afford to lose” and “if you are going to bet, it is better to buy low and sell high.” To that I’ll say, while many alts have been much lower, in terms of BTC pairs we are starting to hit former lows. Meanwhile, its all been a lot higher.
NOTE: See the image below, see how ETH/USD was just inches away from breaking out on the daily chart? Well, BTC’s weekend rained on that parade. However, the setback was minor and there is still room for things to play out (for ETH to see a breakout above those red lines). The one good thing about looking at longer time frames is you suss out a lot of noise and can focus on overarching patterns instead of quickly changing prices. If you want to know what could happen in 5 minutes, look at the 1 and 5 minute charts. If you want to know what might happen in the coming weeks, look at the daily and weekly 😉

ETH, setup for a bunch of Golden Crosses… but so are many cryptos here in late July.
Author: Thomas DeMichele
Thomas DeMichele has been working in the cryptocurrency information space since 2015 when CryptocurrencyFacts.com was created. He has contributed to MakerDAO, Alpha Bot (the number one crypto bot on Discord),...
Thomas DeMichele's Full Bio