Using Bollinger Bands For Automated Trading
How to Create Bollinger Band Strategies For Trading Bots
We discuss how to use Bollinger Bands for automated trading. The key to creating an effective Bollinger Band strategy is finding the right parameters.
To illustrate how to craft a Bollinger Band (BB) strategy we will use Bitcoin as an example, but the reality is what you learn can apply to any market with enough volatility.
Below we’ll walk you through what Bollinger Bands are, some basic Bollinger Band strategies, how to tweak these strategies for bot trading, and then how to automate them for free in the crypto markets using Cryzen.com (a web-based automated trading bot platform).

UPDATE: Cryzen has shut down. The rest of the logic on this page is solid, but the bot I used to illustrate my points is no longer in operation. I would now suggest building your BB strategy with CryptoHopper instead (sign up for your free trial today using our referral link https://www.cryptohopper.com/?atid=1143).
TLDR; Bollinger Bands pair well with automated trading, especially in volatile markets, but to get most out of your strategy you need to adjust a few settings (at minimum 3 – 4 parameters that create the bands) and use stops (to limit downside risks). There is a free-to-use crypto trading bot you try this on at Cryzen, but you can use your own bot as well. Learn more about trading bots.
What are Bollinger Bands?
Bollinger Bands are an indicator developed by John Bollinger. They help to detect support and resistance levels based on volatility and moving averages.
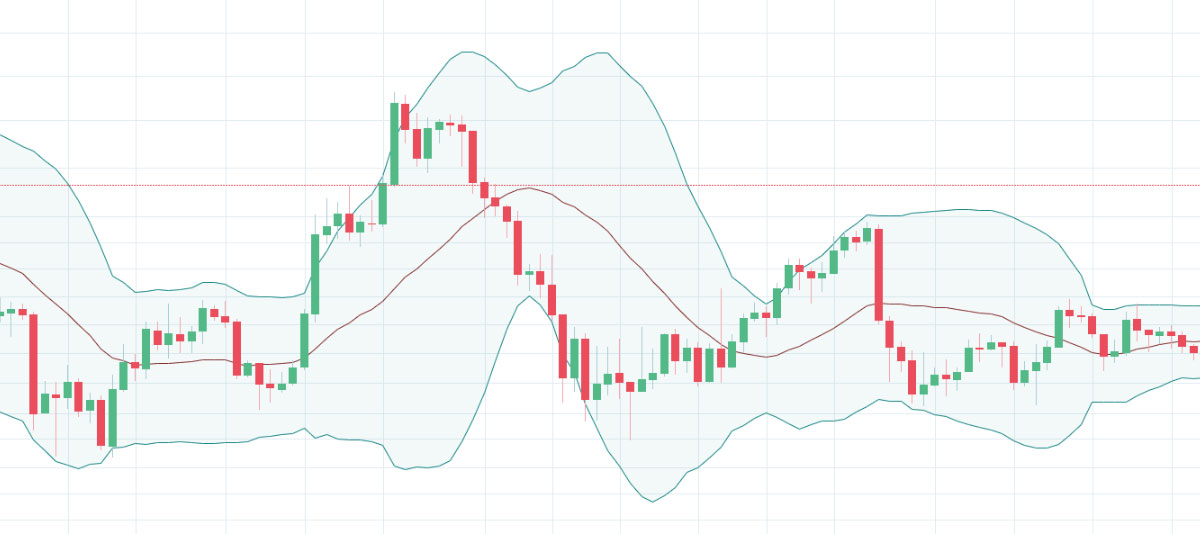
Bollinger Bands are formed from 3 “bands” where:
- The Middle band is a Simple Moving Average (SMA). The period for the SMA is usually set to 20 (meaning it is the average price over 20 candles).
- The Upper band is the SMA plus two standard deviations (a standard deviation is a measure of variation; in this case a number that defines a measure of variation from our middle band that will let our upper and lower bands expand and contract as price volatility changes).
- The Lower band is the SMA minus two standard deviations.
The bands expand when the price is volatile and contracts when the price lacks volatility.
Or to phrase this another way, when the price action deviates from the middle band and toward or past the outer bands, the outer bands widen, and when the price action hugs the middle band, the outer bands contract.
So if the price is steady, the bands will tighten, and if the price is running up, crashing down, or moving up and down a lot, then the bands will become increasingly wide.
The idea behind this all is that the price will generally trade within the bands, but when the price trades toward the bottom or top of the bands it tends to either imply a breakout, breakdown, or reversal.
Thus, from a very simple perspective, the lower band shows where the price is cheap and a good buy, and the upper band shows where the price is expensive and a good sell.
With that last point in mind, a basic Bollinger Band strategy of longing the bottom band and shorting the top band tends to be effective… While a nuanced version of that strategy tends to be even more effective.
We will get to detailed strategies in a minute, but for now let’s just look at an example of some bands.
Bollinger Band Example
In the example below, we are looking at daily candles on Bitcoin in Tether value (BTC-USDT) on the cryptocurrency exchange Binance.
Here I want you to look at the chart and imagine you bought each time the price hit the lower band and sold each time it hit the upper band.
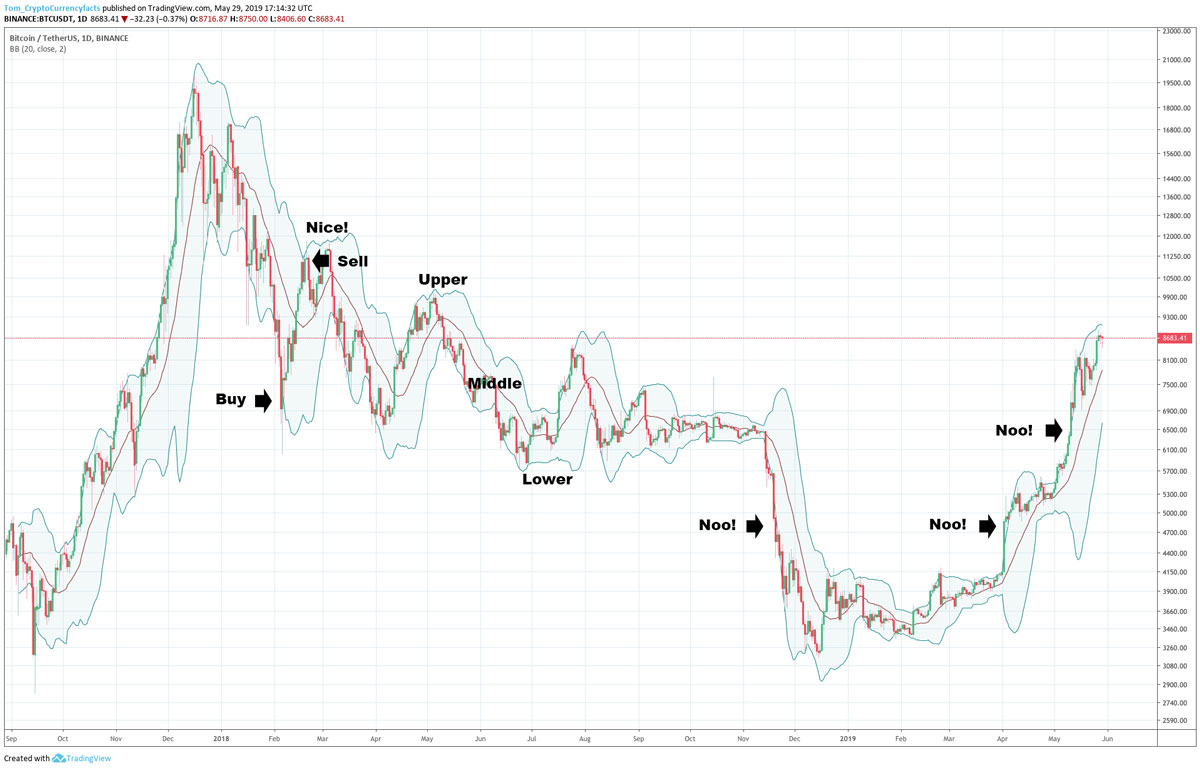
So, hopefully your reaction mirrors the little notes I drew on the chart and is something like, “ok, that worked well at points, nice, but wow… if I had automated that I would have taken some serious losses and missed some epic gains, noo.”
And that is the thing, we can see some good plays here, and we can see an out-of-the box Bollinger Band strategy ALMOST work. but we can also see we need to add more nuance if we are going to automate this.
The reality is, sometimes the absolute best time to go long is right when the upper band is hit, right when that asset is “expensive” (a breakout)). And conversely, at times the best place to short is right when the asset is “cheap” (a breakdown).
John Bollinger’s actual strategy accounts for these oddities (see: https://www.bollingerbands.com/bollinger-band-book), most pro strategies account for these oddities (see one of many examples: https://www.tradingwithrayner.com/bollinger-bands-trading-strategy/), you can be dang sure the bots the big boys use do (classified), and of course we should too.
So then, let’s move on and add in some nuance.
Refining a Bollinger Band Strategy For Automation
There are a number of different ways to refine a Bollinger Band Strategy for automation.
We can program in some complex rules, the sort of ones you find in John’s book, we can add in little details like using stops when we buy (that would have saved a lot of headaches in the chart above), and/or we can adjust some parameters.
One effective method that anyone with a bot can implement, especially if they are using a bot they didn’t program themselves, is adjusting parameters (as almost every bot will let you do this).
So, onto the adjusting parameters section.
If You Don’t Have a Stop Function: If your bot doesn’t have a stop function, consider using an exchange that does or bot that does, but otherwise just pick a place where you will exit a trade that goes against you and stick to it. Effective trading is rooted in risk management.
Refining Bollinger Band Parameters
Now we get to the meat of this article.
First, if you don’t currently have a bot, feel free to create a free account on cryzen.com and use the free one (you can also sign up for the premium version if you wish, remember to use PROMO CODE T61736 for your discount; either one will work for what we are doing here).
Above we discussed we are working with a SMA (our middle band) and two SMAs augmented by standard deviations (our upper and lower bands) to get the core of our bands.
So logically, we will first and foremost be tweaking our parameters that create those.
Specifically, we will be tweaking:
- The period of the middle band (on Cryzen called “WINDOW_MEAN”). This is how many candles our SMA (or mean price) is tallied over.
- The period of our standard deviation ( SMA WINDOW_STD). This is how many candles our standard deviation is counted over. ←— Not every bot will have this, if you don’t have it, use our bot or just ignore it 😉
- The deviation of our upper band (STD_MULTIPLE_UPPER). This is a positive number that considers how many standard deviations above the sma/mean the top band will be.
- The deviation of our lower band (STD_MULTIPLE_LOWER). This is a negative number that considers how many standard deviations below the sma/mean the top band will be.
Now let’s define some basic variables for these parameters, the kind we might use to create a generic by-the-book Bollinger Band.
To start, let’s go with a fairly common 1.5 +/- standard deviation instead of the standard 2 to give us more buy/sell triggers, but otherwise let’s use the traditional 20 day SMA for our middle band.
That setup looks like this on Cryzen:
- WINDOW_MEAN: 20
- WINDOW_STD: 20
- STD_MULTIPLE_UPPER: 1.5
- STD_MULTIPLE_LOWER: -1.5
Now let’s apply those parameters and backtest this puppy!
Backtesting: If you are using automated strategies you should know what backtesting is, but if you don’t, you’ll be happy to learn. Backtesting is when you test your strategy over a period of time to see how it would have performed. You should always backtest every strategy liberally for every market type you want to run it in.
Different Strats For Different Markets: Below I’m looking at a bear market (a market that is trending down), and thus I’m designing a strategy to work in a bear market. We typically want to design at least three different strategies or “strats,” 1. A bull strat for uptrends, 2. A range strat for sideways markets, and 3. A bear strat for downtrends. We are building a bear strat here. I’ll discuss other strats a bit more below.
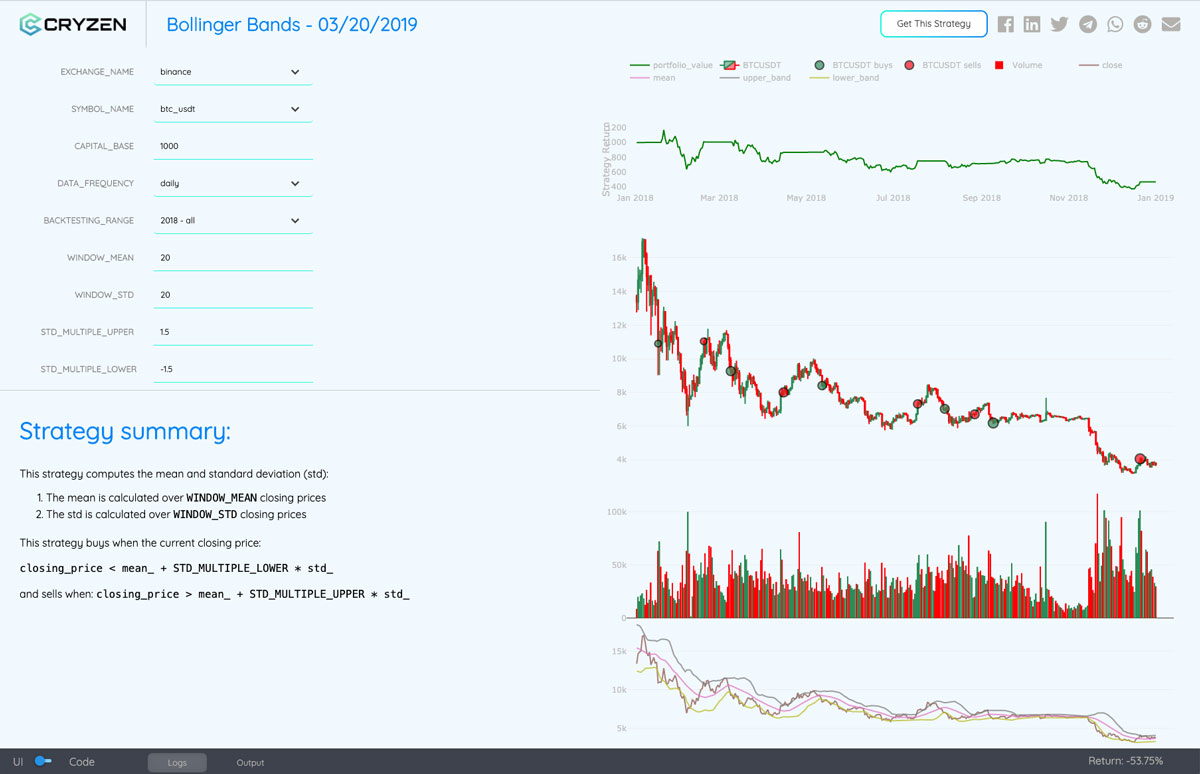
The image above shows our Bollinger Band Strategy backtest. You can see this for yourself here by following this link: https://www.cryzen.com/result/8542/57f141a7-e671-47a7-973c-438c99dead14 (you can use Cryzen to share strategies via a link; cool, right?)
We can see that our out-of-the-box strat didn’t work so well (see our return in the bottom right corner of – 53.75%). Yes, losing 53.75% on Bitcoin is better than HODLing through the bear market and losing 72.33%, but we want to do waaaaaay better than that.
Let’s zoom in and see what went wrong so we can make some adjustments (i.e. let’s “tweak some parameters”).

An image of us zoomed into our Bollinger Band backtest data.
The image above is the same backtest, just zoomed in.
Using Cryzen we can see a visual of not only what our bands look like, but where our buys and sells were as well.
Being able to see what went wrong visually helps us to detect what went wrong at a glance and to better analyze how effective our strategy was. Most bots will give you a visual representation of the data, so make sure to check it.
So, just looking at the above I can see that my sell triggers are better than my buy triggers, but that I want to widen up the bottom band a lot to avoid buying too early (this makes sense, we are designing this for a bear market, so we need to give ourselves ample room to find a bottom).
Also, I don’t think it is helpful that the SMA is so reactive, maybe we can play with a moving average that considers a longer time period (this will require more of a trend to form for the middle band to be moved, which will mean our bands will be slower to widen and contract).
So, let’s double the size of the moving average and give the lower band way more room before a buy will trigger.
Something like this:
- WINDOW_MEAN: 40
- WINDOW_STD: 20
- STD_MULTIPLE_UPPER: 1.5
- STD_MULTIPLE_LOWER: -3.5

Our BB strat adjusted. See: https://www.cryzen.com/result/8545/c87478e2-cf2e-40ab-b4f5-7a942152c14e.
Nice, we have taken a strategy that lost nearly as much as HODL’ing through the bear market and turned it into one that not only beat the 2018 bear market, but actually returned about 6% just by adjusting two parameters!
Still, we can do better.
To do better we can continue to adjust parameters, we can consider how layering bots might work (running multiple bots on one trading pair on one exchange), we can implement some risk management strategies like stops, and more.
Let’s go onto stops next, because I think this is probably the most effective and important thing any trader can do.
Using Stops to Take Our Strategy to the Next Level
So cool, let’s just casually put in a 5% stop loss and see what happens. Probably won’t be a big deal, but who knows.
On Cryzen, it’ll look like this: STOP_LOSS_TRIGGER: .05 (where .05 is 5%).

A Bollinger Band Strategy With Stops. See an example: https://www.cryzen.com/result/8548/63a86d59-29ce-493a-9934-6af228196565.
Ok, cool. So instead of 6% returns we made…. wait, what?!…. We made over 81% in the 2018 bear market?!
Are you kidding me? That is awesome.
?
Honestly though, the reason I added a stop at this point is because I knew we would get a result like this.
Stops are super important when creating custom strategies.
When trading, and especially when automating trading, you have to cut losses on bad trades.
Your goal is to profit from good trades. The more you limit downside, the more you’ll see your returns go up.
Now although we could stop here and deploy this bot, there are ways to make your strategy even more effective.
So for our last section, let’s just talk about how we can kick this up even more.
CAN WE DO BETTER? Yes we can, look at how we missed that price action in the summer of 2018. There are many ways to improve this, one is adjusted parameters, another would be re-entering by hand as we dragged sideways, another is layering bots… I discuss this more below.
NOTE: Below is other info Cryzen outputs. We can see our algo gave us over 81% returns, outperformed the market return by absurd amounts (an excess of 153.68%), and had reasonable drawdown of 18.54% (not great, but reasonable given our total returns and performance against the market).

An example of drawdown in automated trading.
Taking Your Bollinger Strat Past the Next Level and To the Level After That (Also Some Words of Caution)
The above basics will I think give you everything you need to know to create your own effective BB strat. Below I’ll just give you a bullet list of wisdom, caution, and ideas:
- Pay attention to drawdown. Drawdown is the amount you lose in between winning. It is possible for you to blow up your account using a successful strategy if you take big hits in between big in-theory gains. This is why I stressed how important it is to use a stop.
- A backtest isn’t the same as a future test. We never know how a strategy will perform in the future, use low amounts of capital to test your trading strategy or simulate your strategy (paper trade it).
- Different trading pairs require different strategies, most alts are more volatile than Bitcoin. Craft your strategy for the asset.
- Again, you likely need more than one bot (or one bot with different strategies). This strategy worked really well in a bear market, but in a bull market, you are likely going to want to make adjustments. For a bull market you could try flipping your upper and lower band variables to make the upper band wider than the lower, for a ranging market, you could try tightening up both bands and shortening the period of the middle band to trade the market.
- Since you likely need a different bot for a bull, range, and bear… that means you still have to be smart in detecting what the general overall market conditions are.
- You don’t have to spot trade with these strategies, you could use these to margin long and short. Short the top of the bands with a stop, long the bottom with a stop, that is valid too (just higher risk).
- You can use a trailing stop instead of an upper band sell trigger.
- You can buy by hand at let a strat pick your exits (or short entries).
- You can layer bots. One bot may buy at -3.5 on the daily candles, one might buy at -4.5 (in case a stop hits but you still want to be in a position lower). That is just one of countless examples. Maybe you layer a MACD strat and a BB strat? There are so many ways to layer.
- You can buy and sell a cross of the middle band.
- Sometimes you may want to wait to re-enter a position after getting stopped out, especially if you are using tighter bands. Other times you may want to enter a position by hand even if you got stopped out.
- You can play with advanced strategies like shorting a confirmed breakdown or longing a confirmed breakout, although this will require advanced programming.
- And much more.
And that is it. There is a rabbit hole to go down, but honestly all you really need to do is tweak a few parameters and throw on a stop that gives you enough room to run to have a valid Bollinger Band Strategy. Beyond that, it is all about adding complexities and nuances.
Author: Thomas DeMichele
Thomas DeMichele has been working in the cryptocurrency information space since 2015 when CryptocurrencyFacts.com was created. He has contributed to MakerDAO, Alpha Bot (the number one crypto bot on Discord),...
Thomas DeMichele's Full Bio