Bull Market vs Bear Market
How to Tell the Difference Between a Bull Market and Bear Market… And How to Trade a Bull Market and Bear Market
A bull market is when the price action is in an uptrend, a bear market is when the price action is in a downtrend. This is especially true when examined on a larger time frame.
TIP: Some might define a bear market as a 20% correction from highs or greater (especially if this is sustained), and a bull market as 20% gains from the lower or higher. I would tend to define it more in terms of the trend of price action over time. An upward trend is bull, a downward trend is bear, exact percentages don’t matter. One can also look at other factors, like volume (declining volume is generally bearish), a market cap of an asset class (a declining market cap is generally bearish), indicators like RSI and MACD, metrics like sales, etc. The bottom line is bear means down and bull means up, and generally the result of all trends is reflected in price.
How to Trade a Bull Market and Bear Market
As a general rule of thumb:
- Buy the dips in a bull market.
- Sell the rips in a bear market.
- Do both (or do nothing) in a stagnant market.

In other words, general logic and wisdom says:
- When the price retracts in a bull market, it is generally profitable to go long,
- When the price surges in a bear market, it is generally profitable to go short,
- When the price is ranging in a stagnant market, you’ll need to buy the dips and sell the rips to profit.
Of course, that is all easier said than done, because:
- You must put aside fear in a bull market, buying into a correction after the price has come off highs as the price hits or bounces off support. And, one must put aside FOMO in a bear market, selling at low prices right as the price hits or fails resistance.
- You have to be able to detect support and resistance levels, which requires a level of skill.
- You have to switch up your tactics when market conditions change. Usually the pattern is something like, for example, bear -> stagnant -> bull… but it could also be bear -> stagnant (distribution) -> bear… or, bull -> stagnant (accumulation) -> bull. Every mix of the three in any logical order is a possibility.
- Unless you are HODLing a short or long position, and adding to that position on dips or rips, you have to time every dip and rip along a broader uptrend. Timing the market over and over takes time and skill.
Putting Aside Fear and FOMO and Paying Attention to the Trend
Our natural inclination is to sell an asset when it is going down, not to buy. Likewise, our natural inclination is often to HODL an asset we buy low, especially when it is finally showing some strength. However, those inclinations only favor us under certain conditions.
The trend is your friend, and being a bull in a bear market, or a bear in a bull market, is generally a recipe for losing money.
The reality is, no matter how revolutionary an asset is, be it an Apple or a Bitcoin, market psychology can trump even the strongest fundamentals.
In a true downtrend on a longer term scale, buying the dips too hard and fast without taking profit if and when it is an option can lead to ruin. In a true uptrend on a longer term scale, selling the rips (taking profits too quickly) and not buying back in, can mean leaving big money on the table, and shorting too aggressively can lead to ruin.
However, if you can properly detect a bull market and bear market, and if you can learn to follow some basic rules in those markets, you’ll save yourself from HODLing through a great recession without a plan or shorting the biggest bull market of the decade without stops, and if you can really hone your skill… maybe you can even learn to profit despite market conditions.
Detecting a Bear or Bull Market (How to Tell the Difference Between a Bull Market and Bear Market)
With all the above in mind, here are some tips for detecting a bull or bear market that anyone can implement with a minimal effort (I’ll use Bitcoin as an example, but you can apply this to any chart):
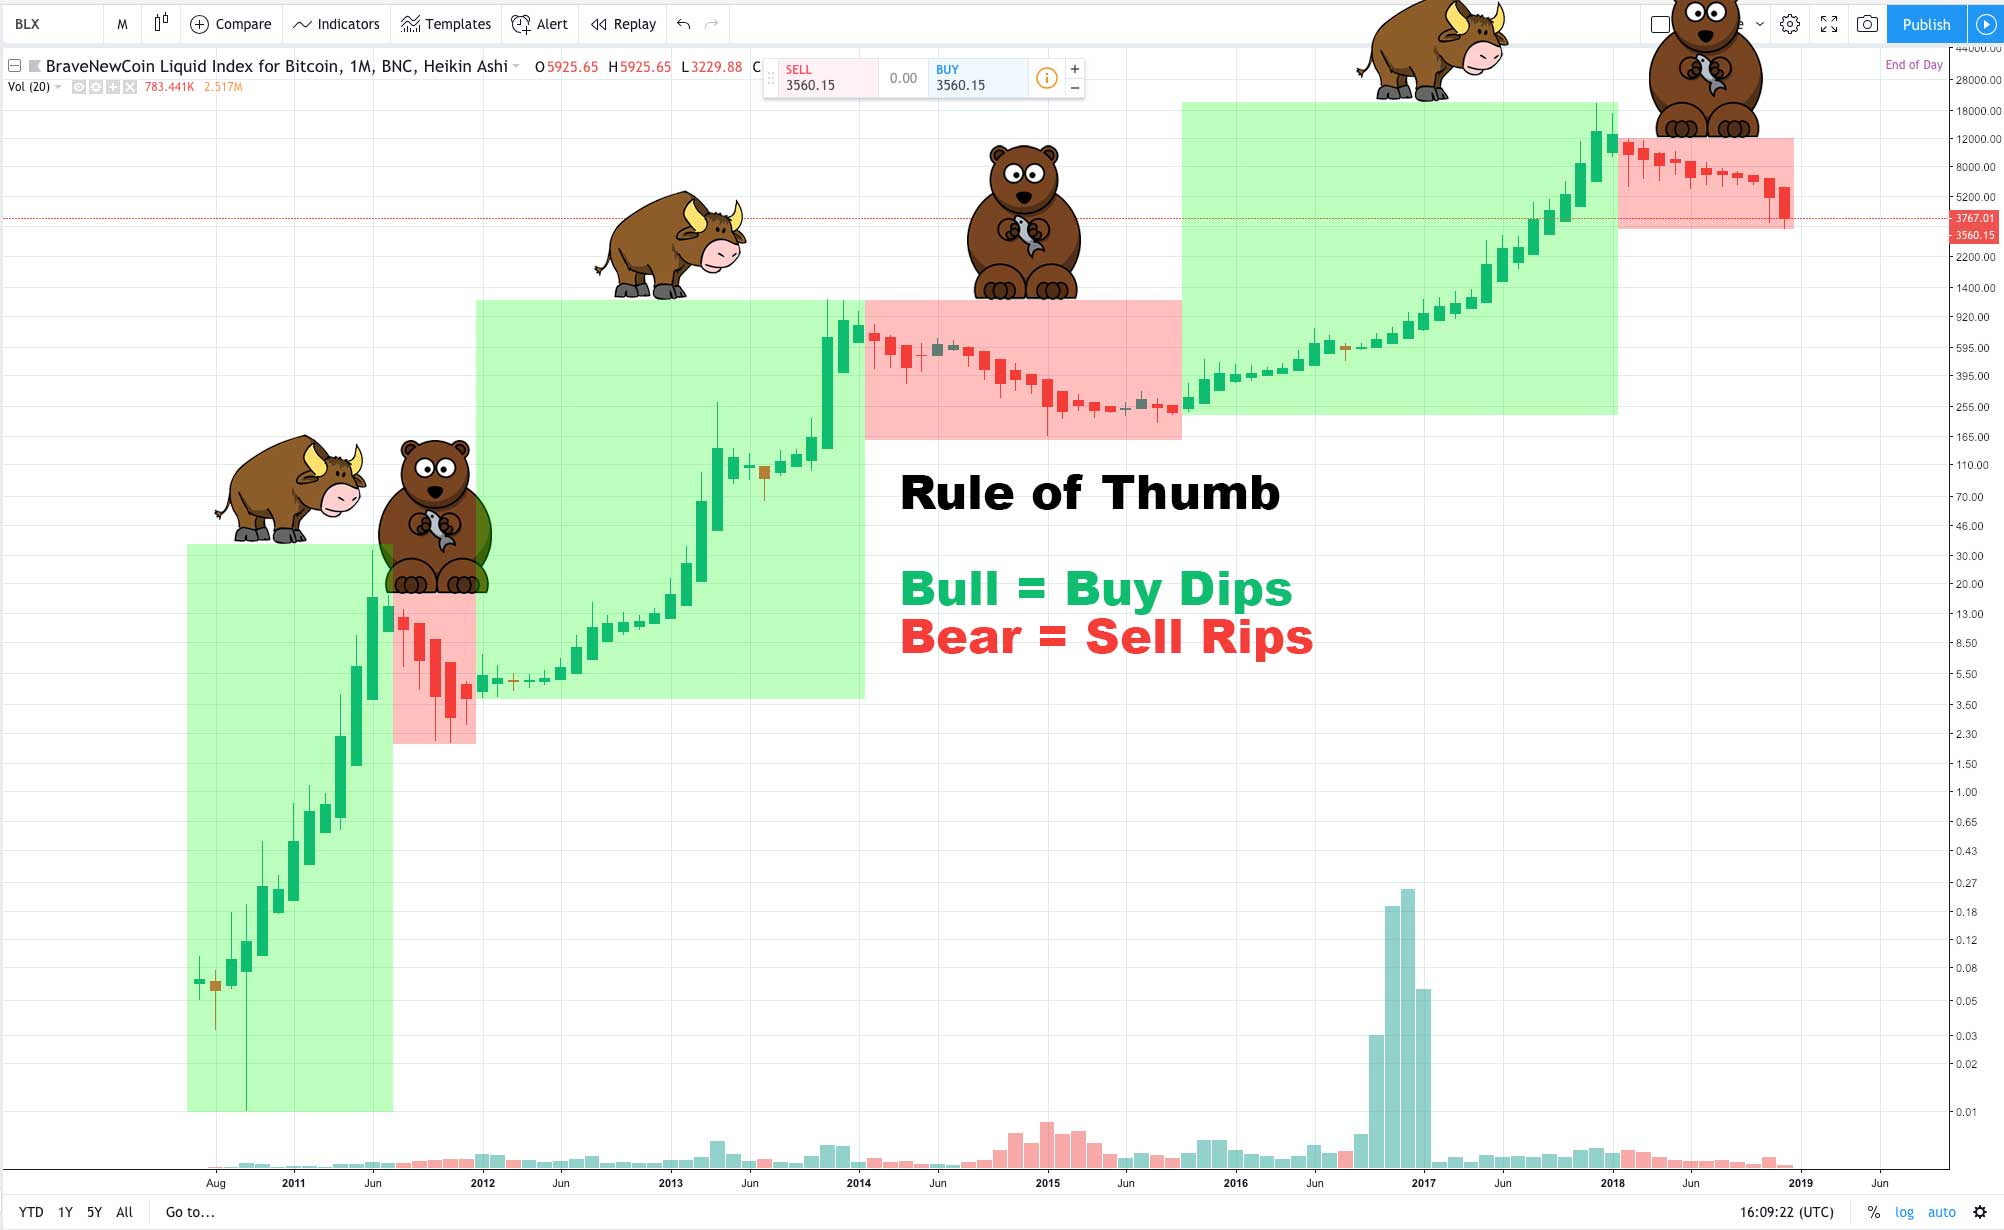
- Go to TradingView, go to charts, and bring up the chart you want to look at. For example, this Bitcoin chart (this is the chart at the top of the page, you can see I’ve marked the bear trends and bull trends clearly).
- Switch the timeframe to monthly candles, and switch the candle type fo Helkin Ashi (a smoother type of candle that trades accuracy for clarity by showing average price moves). NOTE: If monthly doesn’t make sense for the asset, drop it down to weekly and then daily. The point here is to be as zoomed out a possible to see the big picture.
- Now ask yourself, “do I see green candles with wicks pointing up, or do I see red candles with wicks pointing down?”
- If you see green candles with wicks pointing up, you likely want to buy the dips or look for a top to open a long term short position. If you see red candles with wicks pointing down, you likely want to sell the rips or look for a bottom to add to a long term position.
- If you see abnormally long wicks, you could be nearing the top or bottom respectively.
Again, This is All Easier Said Than Done
This is all easier said than done.
It’s easy to see trends in retrospect, but it is hard to see them form in practice.
For example, here is the NASDAQ 100 since the 1980s. It is pretty much all an uptrend, aside from the 2000 and 2008 crashes.
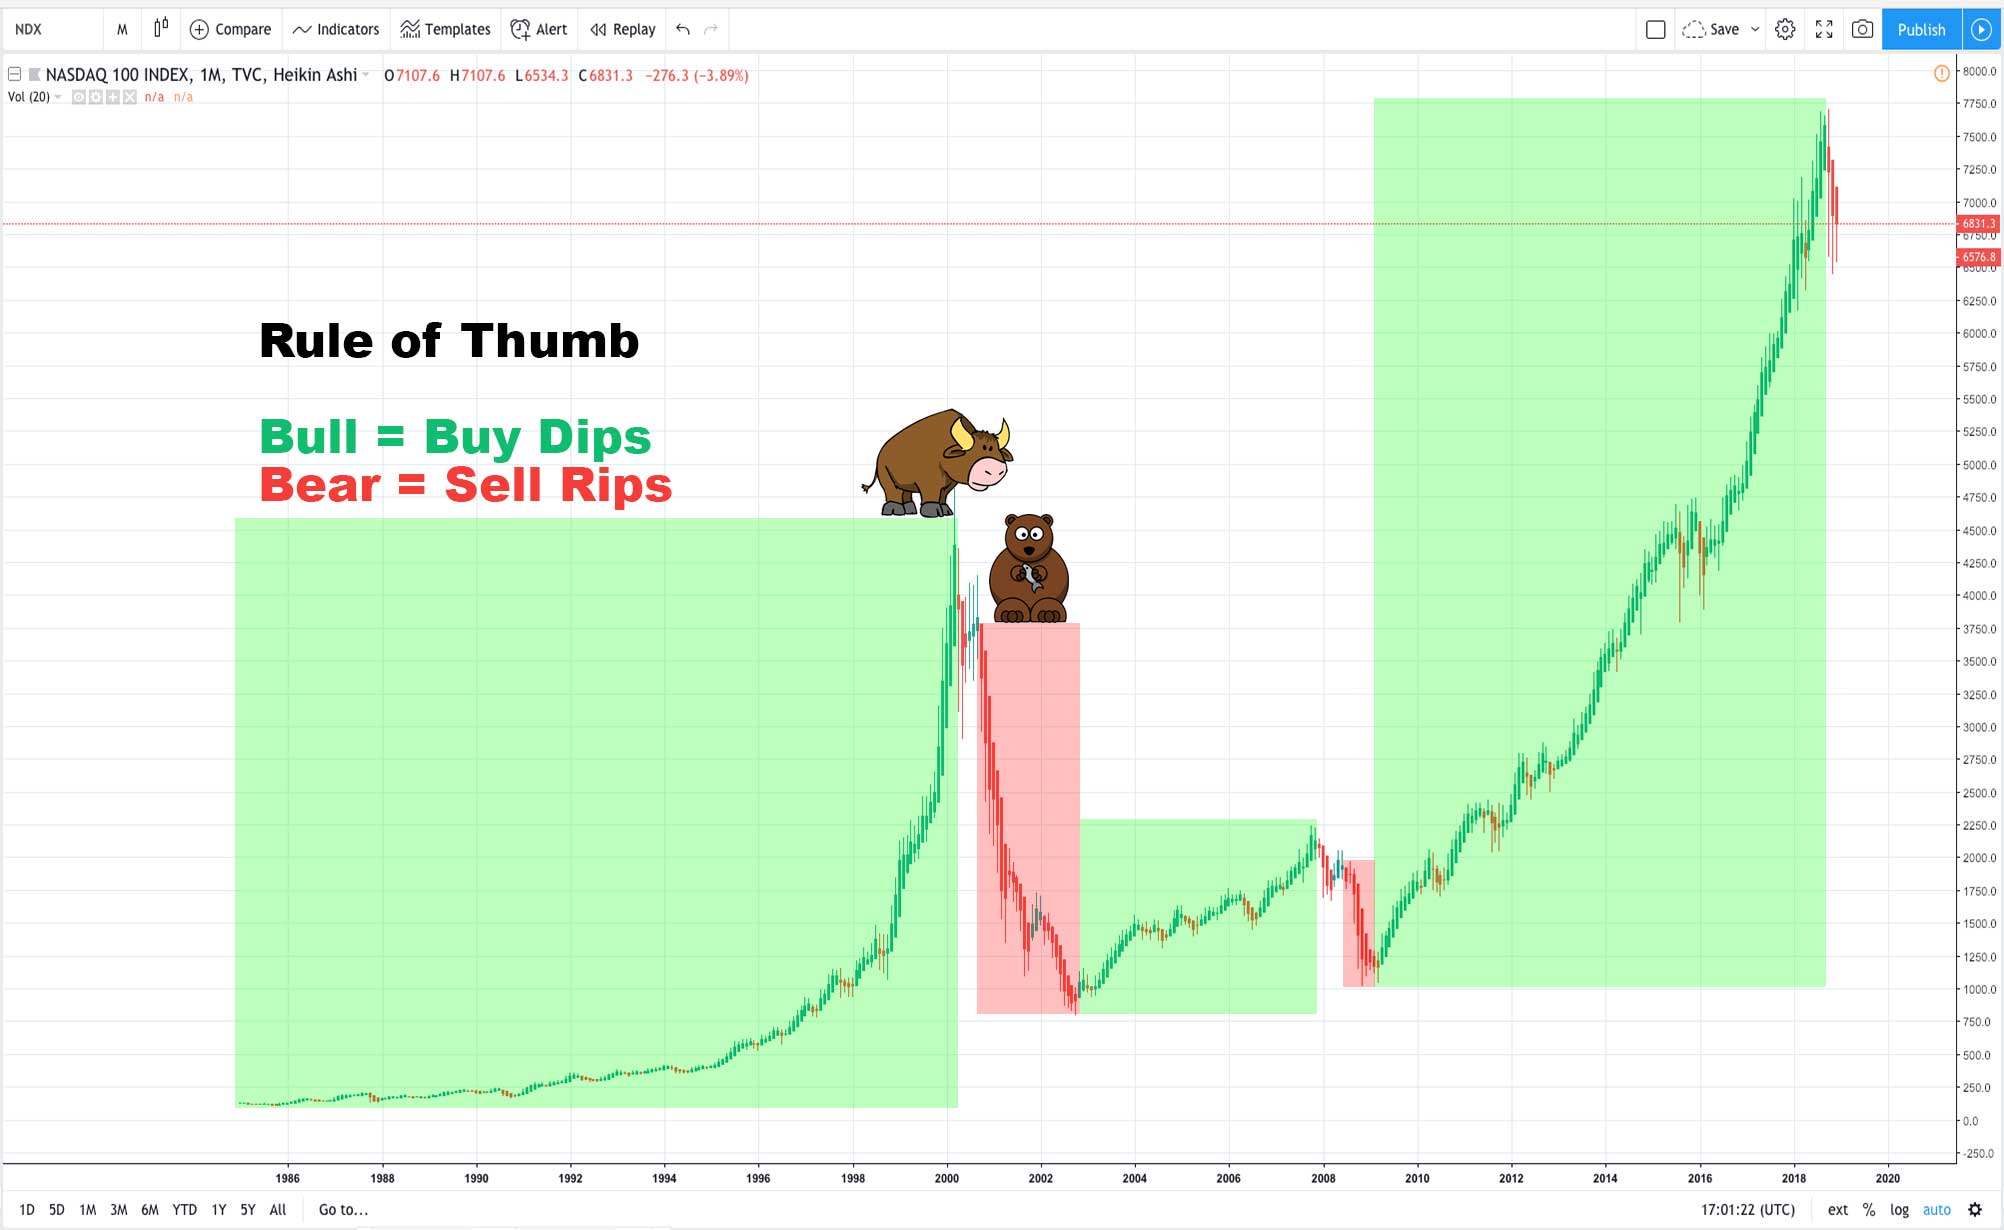
Nasdaq bull vs. bear 1985 – 2018.
The problem is you can’t differentiate a correction in the uptrend from the start of a major recession level crash. If you sell every market that looks like Oct 2018 – Dec 2018, you have to buy back in every time the uptrend resumes (valid, but takes skill).
To really confirm a bear trend takes time, and that could mean taking heavy losses in the interim.
With that in mind, to effectively buy / sell the current market you have to zoom in and use other tactics.
It is very unlikely could ever time the bottom or top just looking at an asset the way I do on this page.
Notice in the BTC chart above you can barely see the first bear market of 2013, it dropped almost 75%… so yeah, zooming out is excellent for detecting harsh and long bear and bull trends, but to get details you have to zoom in and employ other tactics.
Still, I think both the Nasdaq and Bitcoin charts show, you can save yourself a lot of headaches just by using these simple tactics to detect very large overall trends. Imagine only buying stocks twice and selling twice since 1980, or imagine only buying and selling Bitcoin twice since 2011? Very cool, no? If you do that, you can afford to wait and put some profits on the line to see a trend confirmed… if that isn’t your style, then zoom in.
It is all up to you, the point here is just to show you the matrix, not to tell you how to play your hand (i.e., informational content; not investing advice).
Author: Thomas DeMichele
Thomas DeMichele has been working in the cryptocurrency information space since 2015 when CryptocurrencyFacts.com was created. He has contributed to MakerDAO, Alpha Bot (the number one crypto bot on Discord),...
Thomas DeMichele's Full Bio