How to Time the Bottom of a Market
How to Spot a Market Bottom of a Market Cycle
No one can time the bottom of a market, but there are some signs to look for the help you spot the bottom of a market cycle.
Below we will be talking about spotting the bottom of longer term market cycles, not the bottom of quick runs… although the basic logic is mostly the same.
Here are some tips and tricks when it comes to being top at spotting market bottoms:

1: Look for a full retrace to at least where we started before a bull run. If we are back at a support level where we started before we started seeing parabolic price action, and we are hitting support (either the top or bottom of a previous range), it could be a good time to average into a long term position or try to play a bounce. The tech bubble chart below shows what I mean. The first support formed in 1999 wasn’t good enough for a long term play, but was solid for a quick bounce. The next support formed in 1998 before any parabolic action was however an excellent starting point. You got some nice bounces, and then only one more serious drop in 2002. Eventually, over time, buying the top was OK if you HODL’d the NASDAQ from 2000 to today… but let’s be honest, we want that $5 Amazon in 2002, not all time high Pets.com 2000… so we needed to wait and use tact.

Tech bubble infographic
2: Wait for a relatively long bottoming pattern (that is “long” relative to the time it took to rise). As you can see in the NASDAQ chart above, we got a clear bottoming pattern between 2002 and 2003. A long boring stretch of relative flatness sitting on top of 1995 to 1997 support. We satisfied point 1, we retraced to a past support before the parabolic rise, and we are satisfying point 2, a long bottoming pattern that is generally flat.
3: Consider the market price of an asset compared to a fair value of the asset. Is Amazon trading for near what it is worth or less than it is worth? Does it cost more to mine a Bitcoin than it does to buy one? At some point it doesn’t really matter what the chart is doing if the fundamentals are screaming “BUY.” Likewise, if the fundamentals are screaming “SELL,” watch out. Look at the chart below, you can see the S&P’s trailing twelve month P/E (price to earnings ratio) was out of wack before every recession (the grey bars are recessions). Since this is trailing 12 months, if you [in your mind] move the prices on the chart back 12 months, but keep the grey bars there, you can see that before many recessions P/E gets absurdly high, and then market bottoms tend to result in lower P/E. That is a complicated way of saying… if trailing 12 month trailing P/E is absurdly high/low, or if current P/E is absurdly high/low, AND the price has come way down from the peak… it could be a good sign of a bottom. Or more generally, if an asset is trading for less than it is “fair value” (good luck finding that with some assets), then it could be a sign the bottom is in.

P/E ratio of the S&P for 90 years.

S&P 90 year chart.
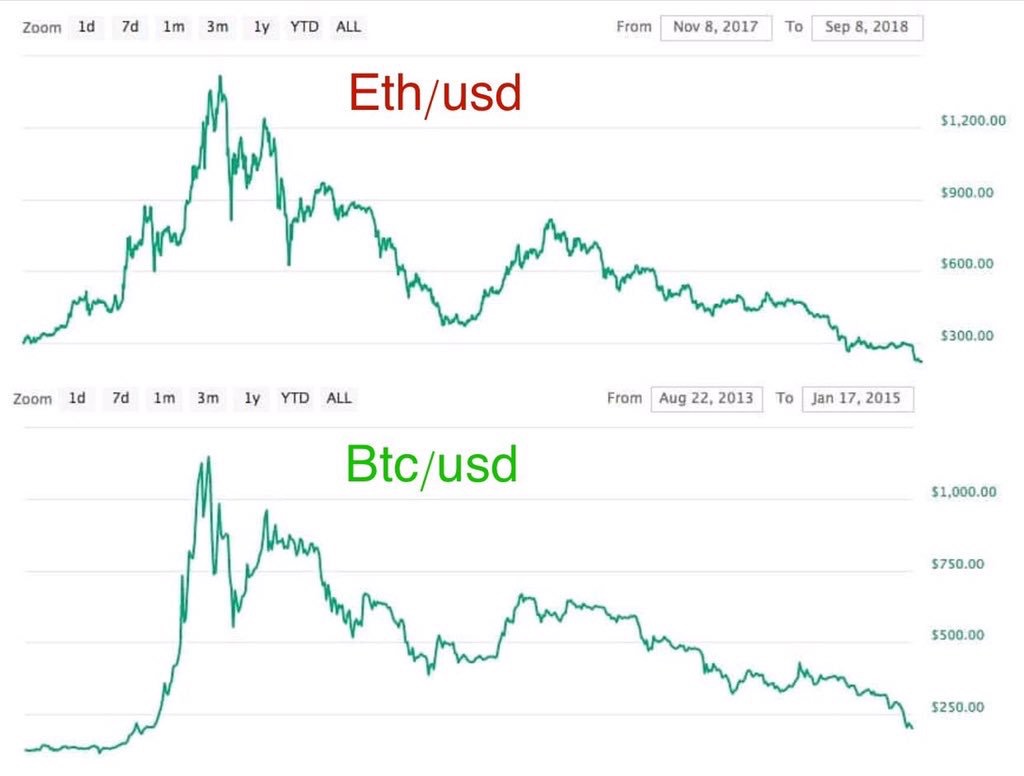
4: Look for volume confirmation (look for very high sell volume, followed by low volume and what looks like a bottoming pattern, followed by very high buying volume on a recovery, over a long period like weekly or monthly candles). In the style of Wyckoff, one solid way to spot an accumulation zone at the bottom is to spot it in retrospect as the asset is taking off again. Here you won’t find the exact bottom, but you’ll have a chance of getting near it. If you think we are taking off from the bottom and entering the start of the next cycle, you can always use stops / trailing stops / short positions as a hedge as a type of insurance in case you get it wrong. Once the uptrend is confirmed, if you got it right, welcome to being long for the next market cycle. You won’t need to do much more than learn about finding the top. Look at Bitcoin 2015 as an example below. Giant red volume candle called the bottom, low volume in between was accumulation, giant green candles on the rise called the next epic bull run.

Bitcoin 2014 – 2015, volume confirmation of bottom.
5: Look for Anger, Depression, Fear, and Despair. Is this officially the next great depression according to all major media? Is Bitcoin dead? Will Gold/Silver/Etc miners have to shut down shop? News tends to lag. By the time everyone is fully aware that they are living in the Great Depression, a bottoming process is likely under way. Once Bitcoin is declared dead, we are likely reaching the bottom of the cycle. FDR won his first election in 1932 on a message of recovery from the great depression, the bottom was in 1932. FDR took office in 1933.

Market Cycles in Cryptocurrency with 2017 – 2018 crypto market cycle, underlying image originally published on http://wallstreetcheatsheet.com/
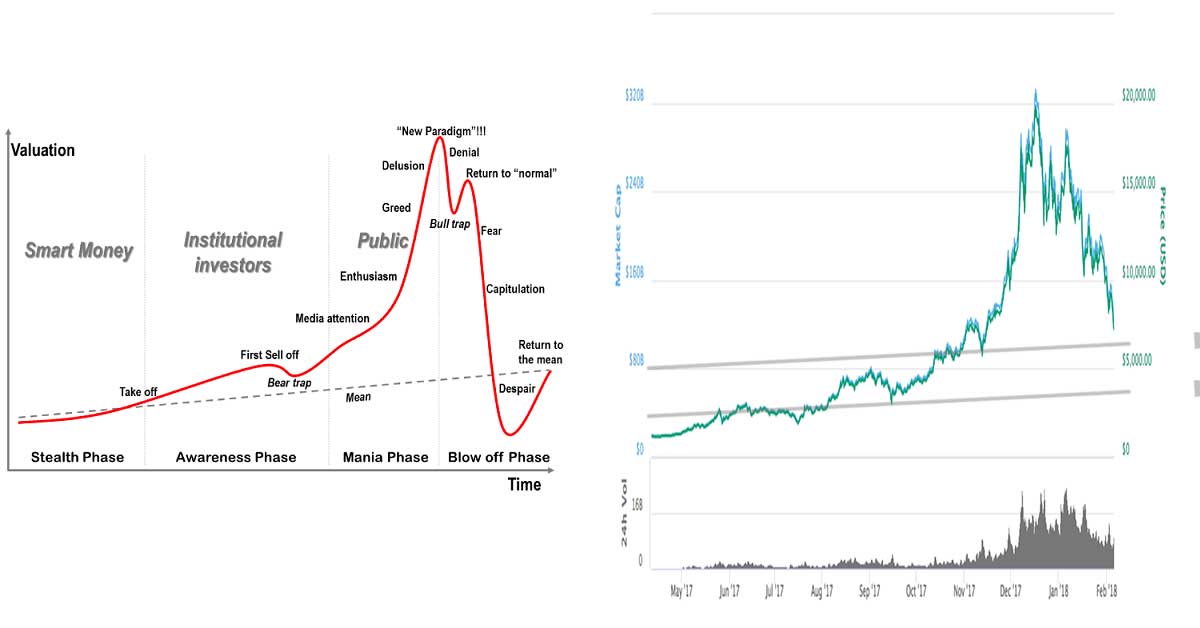
The 2017 – 2018 Bitcoin Bubble popping.
6: Look at the Indicators. Is RSI oversold on weekly and/or monthly? What are the indicators saying? The more indicators showing oversold on high time frames, but show recovery on lower time frames, the closer we could be to a recovery. Look at the weekly RSI on XRP/BTC below. If you only bought XRP when its weekly RSI was between 30 and 40, you would do well over time. Likewise, historically selling when weekly weekly RSI was over 70 has always been the right move. The XRP/BTC chart hints at what we are looking for for a retrace in terms of the lagging indicator RSI. There are many indicators to explore.

Bottomline: If prices are lower than a fair value, RSI is low, volume is giving hints, and we are sitting on top of past support at some point before the parabolic curve up… we might be near or at the bottom of this cycle. Timing exact bottoms is impossible, but you can always average, use stops, and hedge to help ensure a solid position.
Author: Thomas DeMichele
Thomas DeMichele has been working in the cryptocurrency information space since 2015 when CryptocurrencyFacts.com was created. He has contributed to MakerDAO, Alpha Bot (the number one crypto bot on Discord),...
Thomas DeMichele's Full Bio