Opinions on Why Bitcoin Keeps Bottoming Out Between $6k – $7k
Opinions on Why Bitcoin Keeps Bottoming Out Where it Does and Trading in the Range it Does
Bitcoin has been bottoming out between $6k – $7k since its high. In my opinion this can be explained in a few ways, including by the cost of mining and by some technical factors.
NOTE: Below are my thoughts and opinions on why we are seeing the current range and the $6k – $7k support levels we have been seeing in 2018. I can hardly say for sure why anything happens the way it does.
The Cost of Mining
First off, let’s look at the cost of mining a Bitcoin. With the right equipment and energy costs, the cost of mining a Bitcoin is very roughly $6k at the current difficultly and with current hardware costs considered. To keep the Bitcoin network running, people need to mine Bitcoin. If mining Bitcoin isn’t profitable, there will be a decreased incentive to mine.

Less miners would in theory reduce the cost of mining as an effect, as some miners would in theory choose not to mine, however some might mine at a loss (those who mine metals will do this from time to time for example). So the cause and effect of the price going below $6k for a length time isn’t so simple to sum up or predict, but details aside and in general, there is resistance at roughly $6k as a result of the cost of mining a Bitcoin here in early 2018.
NOTE: The cost varies wildly, depending on the cost of hardware and energy and a bit based off luck and competition. A rough range is between $4k – $8k, the median of that is about $6k. If you tried to mine a Bitcoin from home in the US it would likely cost you more than $8k, but get the right equipment at the right cost and go somewhere with dirt cheap energy and you can get away with less (maybe $4k – $5k). Meanwhile, start hiring people and renting space (i.e. running a business) and you have extra costs there. $6k I think is a fair ballpark estimate in this sense.[1]
The Technicals
Second off, and almost more importantly, there are a few key technical indicators that make roughly $7k an important price zone to hold. The simplest way to say this is that a number of technical indicators (like Moving Averages) have squeezed Bitcoin into an ever tightening range since its late 2017 – early 2018 highs.
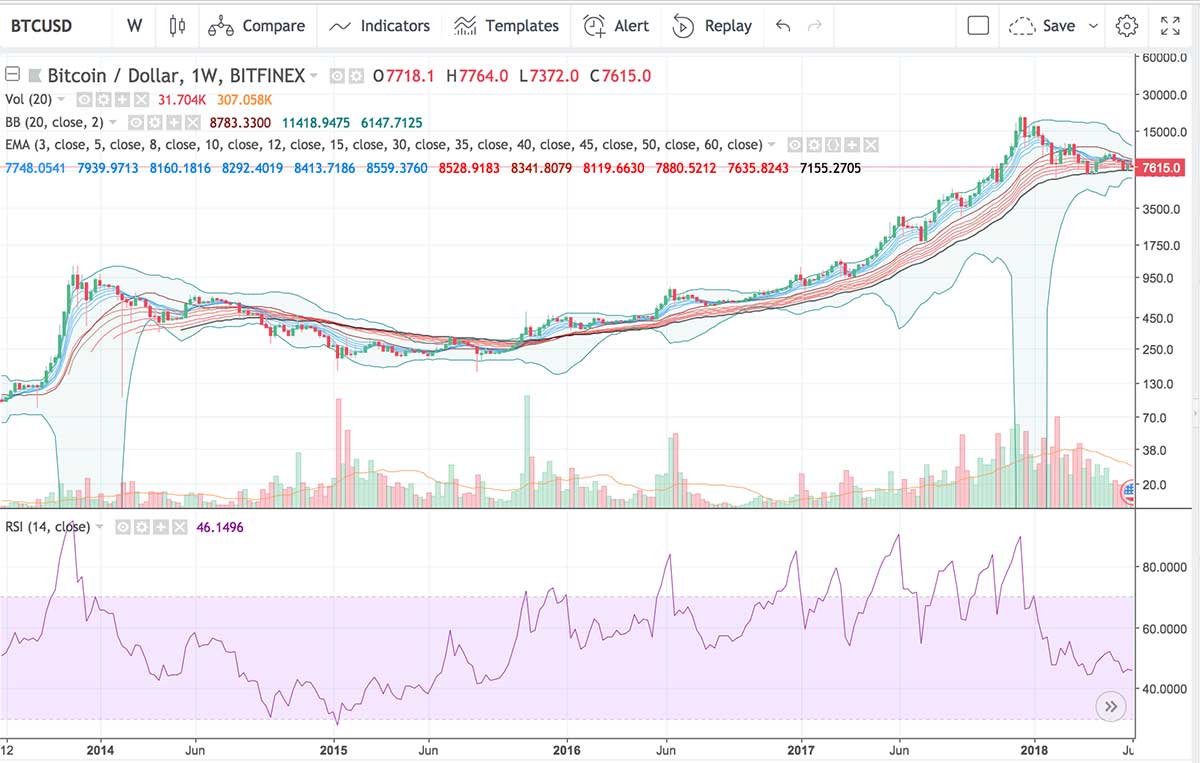
On the top of that range we have roughly $10k and on the bottom the $6k – $7k range. One specific indicator that has been acting as overarching support is the 60 day EMA on weekly candles (odd as that may seem). If you look at this chart, you can see the price has been bouncing off that support since February 2018. Meanwhile, Bitcoin has tended to recover when the RSI has become oversold on daily candles (and shorter timeframes) and drop when it became overbought on daily candles (or shorter timeframes). Consider other popular EMAs and SMAs (for example a standard GUPPY set of Moving Averages), look at the Bollinger Bands on different time frames, and consider other basic indicators and you’ll see the price squeezed between and reacting to these indicators (some acting as support, others as resistance, depending on the time frame).
Likewise, if you look at indicators like Fibonacci Retracement levels and Elliot Waves (which are somewhat subjective in their application) you can see the reactions to those as well. The point here is that a lot of what is happening is purely technical. With that in mind, “bears” are constantly trying to push Bitcoin (and thus all cryptos as an effect) below key levels, while bulls are trying to push Bitcoin up and breach key levels. This push and pull since the the recent highs has increasingly resulted in a sort of grand equilibrium.
That equilibrium is currently occurring in the $7ks (which works well in terms of sustainability; as miners can find a profit here even with price fluctuations)… that said, the same thing occurred in 2014 before eventually being ground down to much lower levels…. which is ultimately what the “bulls” are trying to avoid.
The Log Chart and the Long view
Third, let’s look at Bitcoin’s logarithmic chart, on weekly candles, from late 2013 to today (the chart in the header image). As you can see in my “slightly” busy chart, there is an overarching pattern potentially repeating. If the pattern repeats, it includes a drop in the upcoming days, weeks, or months [depending on how you read the chart] which sees Bitcoin drop below many Moving Averages, touch the bottom of the Bands on the weekly candles, and sees weekly RSI become oversold (i.e. it sees the price dropping by at least 50%; so about $3.5k – $4k… if not a little bit more for a short period of time). This is at risk of happening if Bitcoin starts to close below $7k – $6k on the weekly candles (meaning it would need to for example sit in the $5ks for over a week and then fail to recover).
Of course, patterns don’t have to repeat exactly, and forcing Bitcoin down to $5k for weeks is likely to be much more costly for bears in 2018 than it was in 2014. After-all, 2014 is a much different environment than 2018, with more big players having much bigger piles of capital to defend key zones. Meanwhile, both sides now have futures contracts to hedge against any capital they throw at a losing bet on the exchanges.
TIP: In general markets move in cycles, you can see some clear market cycles in 2018 (see here and here for example) and you can see a potential overarching cycle in the chart above. A certain amount of all the action and reaction is due to the acceptance that cycles do occur and it is easier to go with the flow than to try to fight against the tide.
The Ramifications of the Pump (and Dump) Over the “Futures” News
Fourth, there is a simple thing going on here. Bitcoin was trading at roughly $6k – $7k before the bout of mania kicked in during November 2017. In November Bitcoin was essentially “pumped” over the “news” that futures trading was coming. In many ways what is happening is simple, we keep retracing to that same starting point over and over.
In this sense the all the fireworks and pumping is essentially being paid for over and over again as Bitcoin attempts to find stability after being thrown out of whack. Back in 2013, when Bitcoin was pumped in much the same way, the same sort of after-effect occurred.
Liquidity
Fifth, it is a matter of liquidity. If there is a lot of sellers at $10k and not a lot of buyers, then the price is bound to pull back in that zone. Likewise, if the low $6ks present us with many buyers and not enough sellers, then the price likely to bounce. The market in general is chasing liquidity (price points where a lot of trading will happen; this requires buyers AND sellers). The bears or bulls might take us one way or the other, to capitalize on the volatility or to buy/sell Over the Counter… but no one will waste too much money holding a zone that can’t be held.
In practice, for a myriad of reasons (many described on this page), $10k and $6k have for the past few months have been such zones. The one thing to note here is however that anyone who has an especially large position in crypto, but who accumulated it early and is looking to ease out, benefits from the price going up and then down into the lower ranges. As, although they have to take a lower price on their crypto, they can offload large amounts easier due to the liquidity (created by demand) at those prices.
TIP: A lot of buying and selling by big players happens Over The Counter (AKA not on the exchanges, but through brokers who facilitate large transactions between parties). Big players will also hedge using derivatives and leveraged positions (like Bitcoin futures, Bitmex contracts, Bitfinex long/short positions, etc). This these “whales” (sometimes acting as single traders, but often as many traders in a hedge fund or group of funds) do things like dump a ton of crypto on the open markets at a loss to force the price down, or to buy up much of the available supply to pump a crypto. At the same time, players are buying Over The Counter at a specific price and then going to the exchanges to tactfully unload that plus the crypto / fiat they got from trading at a profit. So there is a whole other side to the game for these players. This is important to understand when trying to understand why prices are doing what they are doing, some of it is technical, some of it is organic supply and demand, some of it is logical (like mining costs), but some of it is essentially pure tactful manipulation for a specific end… often with those other factors in mind.
The Goals and Intentions of Investors, Traders, and Users
Lastly, it is important to understand who benefits from what sort of price action.
Those who trade, who long and short Bitcoin for profit (speculation), who operate exchanges (they get transaction fees from traders), who pump and dump coins, and who wish to accumulate vast sums of crypto all benefit from volatility. For them it is generally ideal for prices to bounce around, as that means more opportunity. These people don’t all have the same ends to say the least, but they all benefit from the same environment.
On the other end of things are your average investors, miners, developers, those building businesses around cryptocurrency (many businesses benefit from increased value or stability and not volatility), those who use crypto for transactions (for them stability is ideal), and those who have already accumulated massive amounts of crypto as an investment. For this group a stable but gradual price increase is generally ideal.
The Bottom Line
Ultimately, all that said, what truly dictates the price action is where people are willing to buy and sell. The more traders / investors in the market, the more that zone is dictated by the masses and not the massive (i.e. the big players). Unfortunately, or not, at this point and time the market is lacking the retail volume and interest it saw back during the recent highs (one can gleans this from Google search trends and trading volume on the exchanges for example).
Bottomline: Bulls are trying to keep Bitcoin above some key levels, bears under them, but in general Bitcoin is sandwiched between some key levels created by past price action. This price action has created a temporary support range of about $6k- $7k (which also happens to be the cost of mining a Bitcoin AND the price Bitcoin was trading at before the November 2017 pump). Holding that support is good for sustainability and generally for many investors. In a world in which Bitcoin remains stable from here, buying the bottom of that range is an attractive investment (at least more attractive than buying high). In a world where 2014 repeats, that $6k – $7k support is liable to become resistance (potentially for a year or more if 2014 repeats). To me the big question here is “is a pattern occurring in the logarithmic chart, and if so what stage of the pattern are we at?” The main question being, “are we at the dip before another recovery attempt (which could potentially even become a true rally this time) or are we at the part where we grind down and have to wait a few years while miners scramble and crypto businesses stagnate?”
- Here’s how much it costs to mine a single bitcoin in your country. MarketWatch.com.
Author: Thomas DeMichele
Thomas DeMichele has been working in the cryptocurrency information space since 2015 when CryptocurrencyFacts.com was created. He has contributed to MakerDAO, Alpha Bot (the number one crypto bot on Discord),...
Thomas DeMichele's Full Bio