What if Summer 2017 – Fall 2018 Was Actually a Correction After Early 2017 ETH Bull Run?
ETH Fractal Correction Theory
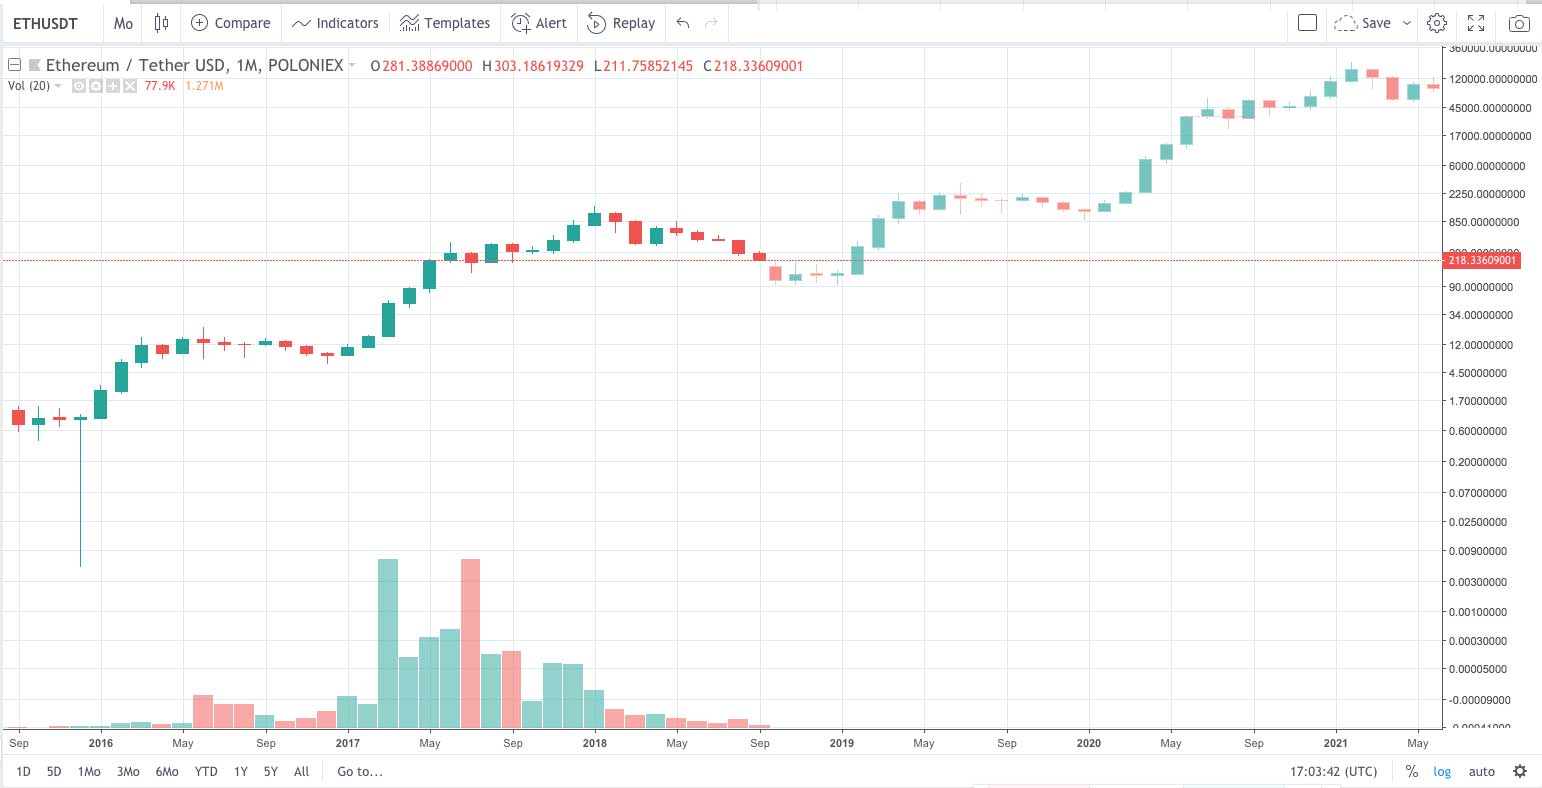
What if Summer 2017 – Fall 2018 was actually a type of correction for ETH, a response to the epic bull run of late 2016 – early 2017? It would fit the pattern of what happened between early 2016 – late 2016.
Just look at the charts above (monthly ETH fractal) and below (weekly ETH fractal). What if ETH is a fractal, what if the same pattern essentially just keeps repeating?
It would mean that times that look like the end are really just parts of a larger bullish cycle. I mean, look at that chart at the top of the screen. In terms of losing money on paper it is scary (with ETH hitting maybe $50, $100, or $150 if it is that $200 isn’t the bottom; who knows), but visually as a chart it almost looks like a reasonable upward progression.

What if ETH is a bullish fractal all the way up? This is the definition of a long shot.

You wouldn’t think a “correction” would include a 12 month long run from $400 to $200 to $1,400 and down to $200 again… but of course in 2016 you probably didn’t think a correction would see an all time high of $20 and a low of $6.
Simply put, we don’t think of corrections as long sideways things after runs, we think of them as pull backs after a run (like $1,400 to $200), yet on log scale from a zoomed out view, the large sideways ranges do look like “corrections” of sorts.
In 2015 ETH saw a low of $0.42 cents, and in 2016 it saw a low of $6, and the dramatic increases in between as you can imagine do require a complicated and long correction-of-sorts to maintain.
The chart above tells the story. The story is: long “sideways” movement [that is roughly sideways on a log scale, which can include things like a 500% move upward and a 90% correction] is the correction phase [a correction that includes all time highs oddly enough] and then the short upward spurts are the actual bull runs where the long term gains are made.
This is why even though ETH spends so much time looking dead, moving sideways, and favoring bears and traders over holders it can none the less make epic and rather gains over time which favor holders.
Apply this logic across the board and the way the crypto market works starts making a little more sense. As you can see with BTC below, there is a ton of ground that is never given back despite long periods of sideways movement due to the epic and quick runs in between.
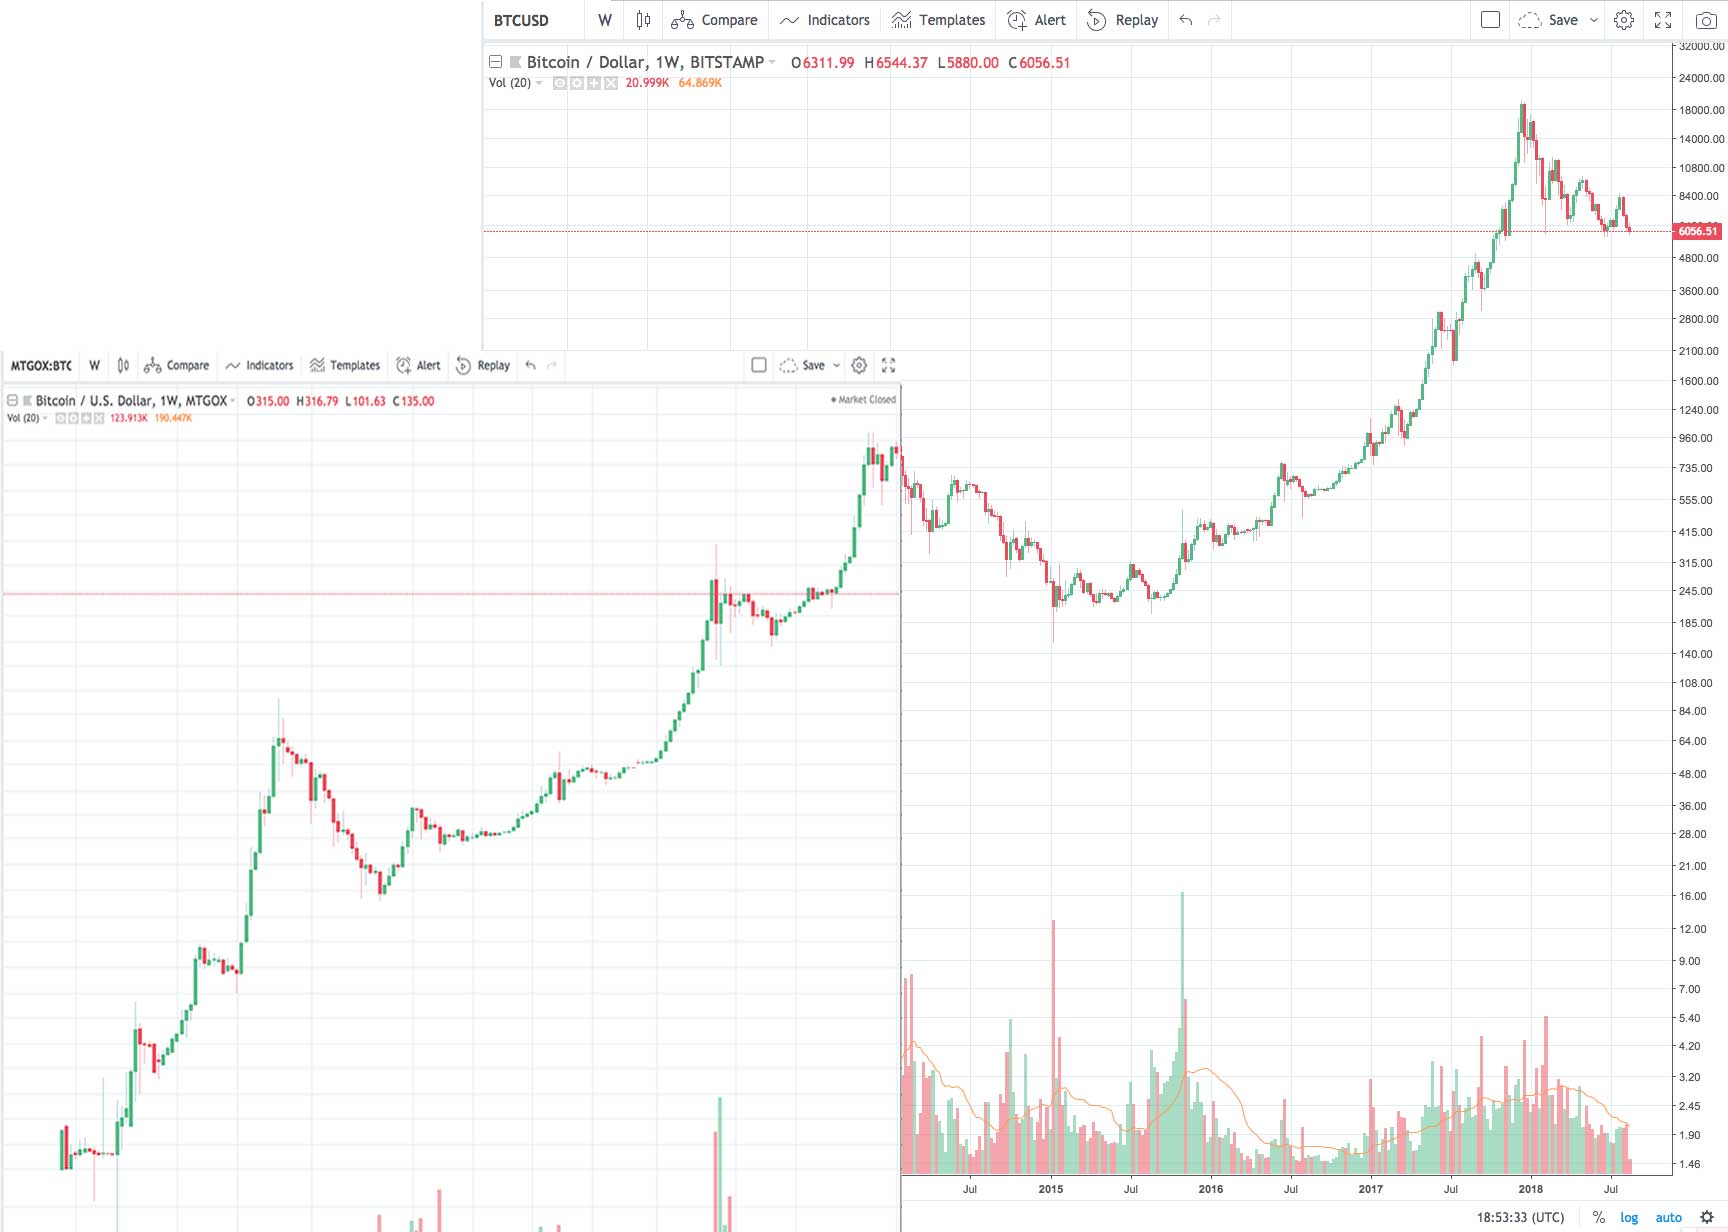
Bitcoin is essentially a bullish log fractal, 2010 – 2018… you know, so far.
Author: Thomas DeMichele
Thomas DeMichele has been working in the cryptocurrency information space since 2015 when CryptocurrencyFacts.com was created. He has contributed to MakerDAO, Alpha Bot (the number one crypto bot on Discord),...
Thomas DeMichele's Full Bio