Top 10 Cryptos of Jan 2015 Compared to Sept 2019

“Looking to the future from the vantage point of January 1, 2015”; Or, “these were the top ten coins then, and where are they now?”
We have compared the top 10 cryptos of Jan 2015 with the top 10 of Sept 2019.
Comparing these is one way to test common ideas like “the current top alts must die before the next cycle,” “the current top alts won’t be the same next cycle,” “you can just average into the top 10 and be OK,” etc.
Generally speaking, we simply want to answer the question, “was buying and holding the top 10 in 2015 a good move?”

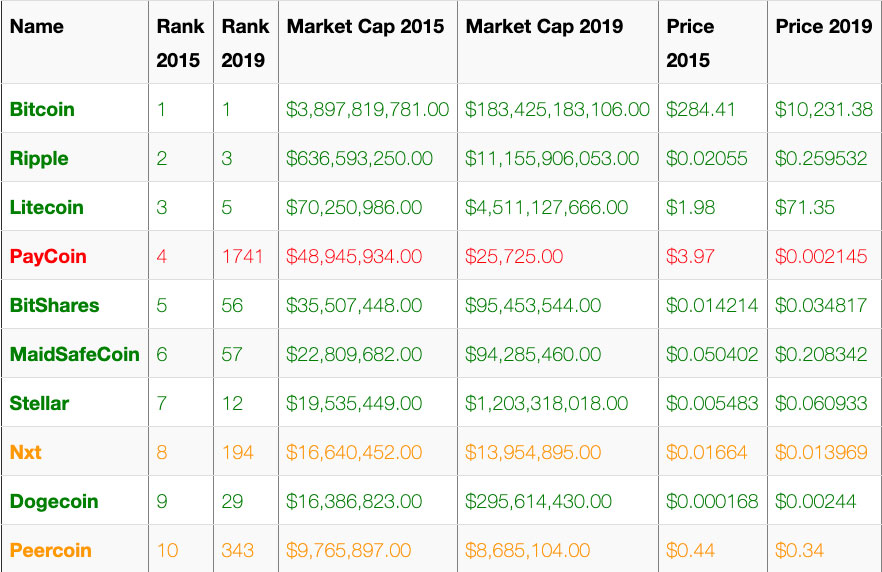
Let’s look at a chart:
Jan 9 2015 compared to Sept 2019 between 12 pm – 12:45 pm PST (data from CoinMarketcap).
| Name | Rank 2015 | Rank 2019 | Market Cap 2015 | Market Cap 2019 | Price 2015 | Price 2019 | Volume (24h) 2015 | Volume (24h) 2019 |
| Bitcoin | 1 | 1 | $3,897,819,781.00 | $183,425,183,106.00 | $284.41 | $10,231.38 | $18,944,900.00 | $14,160,334,901.00 |
| Ripple | 2 | 3 | $636,593,250.00 | $11,155,906,053.00 | $0.02055 | $0.259532 | $1,126,470.00 | $978,739,684 |
| Litecoin | 3 | 5 | $70,250,986.00 | $4,511,127,666.00 | $1.98 | $71.35 | $2,224,230.00 | $2,853,518,201 |
| PayCoin | 4 | 1741 | $48,945,934.00 | $25,725.00 | $3.97 | $0.002145 | $187,475.00 | $7 |
| BitShares | 5 | 56 | $35,507,448.00 | $95,453,544.00 | $0.014214 | $0.034817 | $95,469.00 | $2,274,983 |
| MaidSafeCoin | 6 | 57 | $22,809,682.00 | $94,285,460.00 | $0.050402 | $0.208342 | $4,593.00 | $356,192 |
| Stellar | 7 | 12 | $19,535,449.00 | $1,203,318,018.00 | $0.005483 | $0.060933 | $101,666.00 | $134,781,213 |
| Nxt | 8 | 194 | $16,640,452.00 | $13,954,895.00 | $0.01664 | $0.013969 | $37,146.00 | $667,411 |
| Dogecoin | 9 | 29 | $16,386,823.00 | $295,614,430.00 | $0.000168 | $0.00244 | $320,203.00 | $28,762,958 |
| Peercoin | 10 | 343 | $9,765,897.00 | $8,685,104.00 | $0.44 | $0.34 | $82,782.00 | $86,978 |
The chart above is pretty clear.
Buying and holding the top 10 coins at that moment in time in 2015, and then holding until today was an insanely profitable move overall.
However, 70% of the coins (Bitcoin, Ripple, Litecoin, BitShares, MaidSafe, Stellar, and Dogecoin) vastly outperformed the other 30% (PayCoin, Nxt, and Peercoin).
Also, notably, PayCoin ended up getting, as they say, “rekt.”
Now with that said, clearly, as we can see in the chart, PayCoin ended up just being pretty much a one pump chump pump and dump:
So what do we actually see then, we see that buying and holding a spread of top coins was a solid idea at the time, that buying and holding the latest hyped coin that popped to the top of the charts out of nowhere was a poor idea in retrospect, and that but trying to pick winners and losers was risky… unless your picks for winners were the top mainstays like Bitcoin, Ripple, and Litecoin.
In short, this case-study favors the bulls, but cautions about putting too much faith in the new hot coin of the moment just because it is pumping, and instead favors picking from a basket of mainstays with a focus on top coins like BTC.
Or at least that is my takeaway.
NOTE: For more comparisons, see the top 10 of 2016 compared to 2019.
