Major Alts Show Strength as BTC and ETH HODL Ground
TRX, ADA, BCH, XRP, and LTC have all had impressive runs recently, as did ETH in its own right. Meanwhile BTC is holding its ground.
We now have most major coins well above their 2018 bottoms in both USD and BTC values, and have some coins like TRX and XRP well beyond that.
Meanwhile many other alts have been preforming well. I can’t list every alt, but ENJ, DODGE, and WAVES come to mind as standouts.

In sum, 2019 has been off to a very respectable start.
We are hardly out of the woods yet, but of course the problem with the long crypto winter is that perfectly timing the bottom is a bit of a fool’s errand (an impossible task for the average human).
For my money, one either has to have a strategy for buying on the way down… or the guts to take a chance and buy in when we see strength.
Some may be looking for clearer signals, for example clear breakouts in BTC and TOTAL (the total market cap), that is reasonable, but it is hard to argue that we aren’t seeing a nice setup here for crypto as a whole and some already respectable runs for TRX, ADA, BCH, XRP, LTC, ETH, and more.
Take a look on any chart mentioned above in USD or BTC and you’ll see key emas either setting up to form or forming bullish crosses and you’ll see price action above key EMAs in most cases. Take a look at the bands, or clouds, and you’ll see bullish signs as well. The reality is, a lot of indicators are looking good on higher time frames, and that is really all you can ask for in terms of technicals.
The longer you wait, the clearer it’ll get one way or another, but ultimately there is no way to know if the bottom is in, or if this is just a suckers’ rally on the way to lower lows.
Still, for the moment there are a lot of nice looking charts in the top coins by market cap, and that is reason to give the crypto markets a second look.
Coinbase coins: Every bull run in recent history has started with BTC, ETH, and LTC (the longstanding main Coinbase coins) showing strength. We finally have that for the first time since the April run. That doesn’t mean anything for sure, but again it is a nice sign.
GBTC: Every bull run since late 2017 started after GBTC had lost a large chunk of its premium. We just got that recently too, and GBTC’s premium is actually still rather low. Again, this doesn’t mean anything for sure, but the market price and value of GBTC converging has historically been a bullish indicator for crypto.
Looking at charts: Look at the two charts below, the first is a current BTC chart created one day after this article was written. Bulls wanted to see a breakout above the 100 day EMA (green line)… instead what they got was a breakdown below the 50 (red line). That is why some more conservative traders might have wanted to “wait for the breakout in BTC [and TOTAL].” However, look at the ETH chart below from a few days ago, same basic setup BTC had, but with ETH, ADA, TRX, and more the eventual move was a break up above the 100 day EMA. We can see that the setup was there for BTC, and we can see that other pairs had successfully crossed the threshold, but BTC didn’t make it this attempt. Now we have to wait and watch and see if it’ll make another attempt or not.
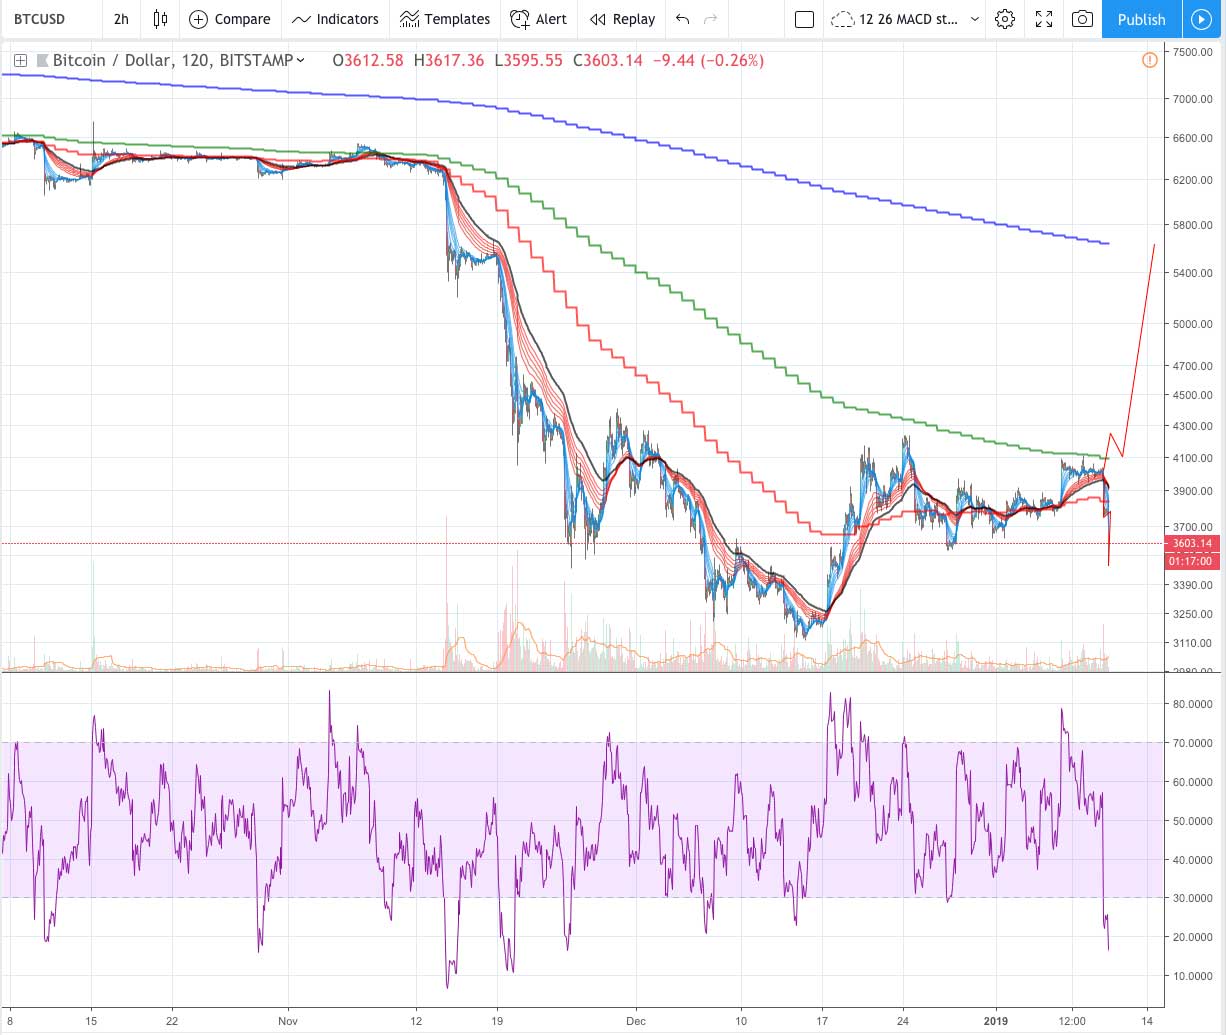
BTC doing the exact opposite of what bulls hoped to see.

ETH/BTC since 2015 showing ETH breaking out in terms of moving averages.
Author: Thomas DeMichele
Thomas DeMichele has been working in the cryptocurrency information space since 2015 when CryptocurrencyFacts.com was created. He has contributed to MakerDAO, Alpha Bot (the number one crypto bot on Discord),...
Thomas DeMichele's Full Bio