Is 2022 Going to be 2017 2.0?

There is a general sentiment that 2021 gave us the market peak and we have maybe even started a bear market. But what if 2023 is the new 2017?
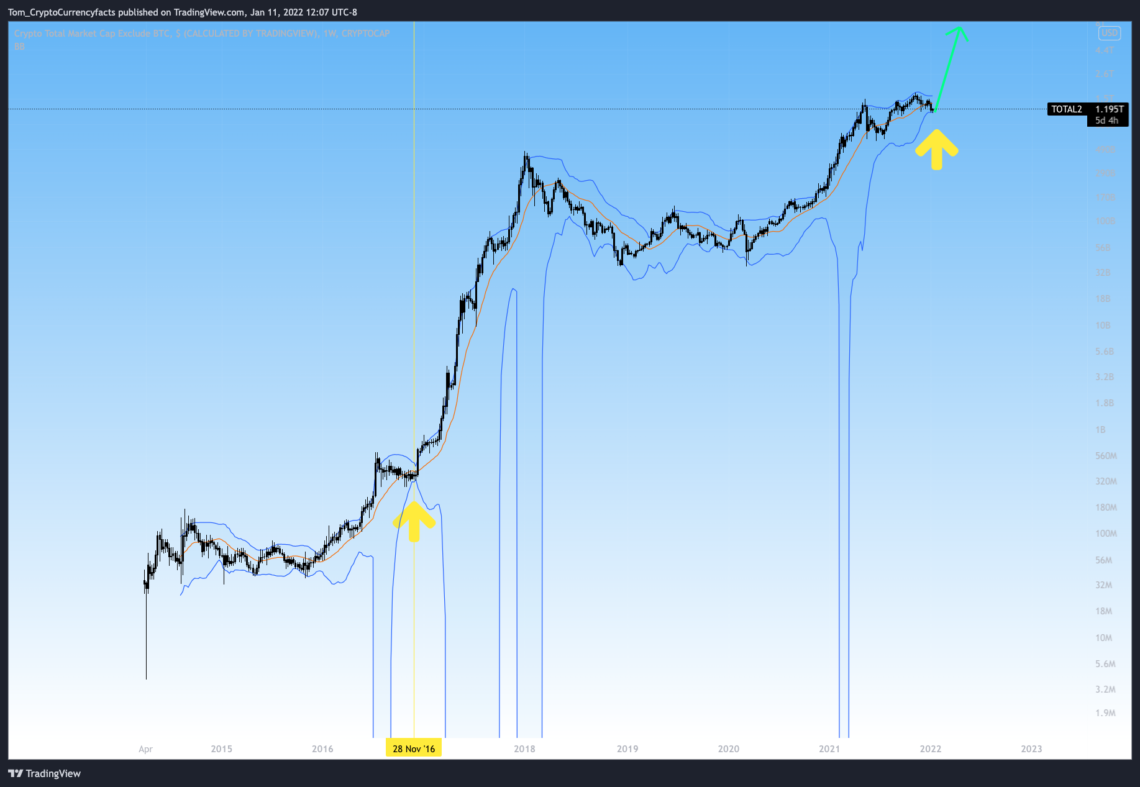
Look at the TotalCap2 (the market cap of crypto without BTC) charts above. What if 2021 was like 2016, and the next thing we get is 2022 being like 2017. It may seem crazy, but the reality is 2015 to 2016 saw a rise of very roughly 10x for BTC ($100 – 1k), just like 2020 to 2021 did (3k – 30k; or you could argue 20x+ at 3k to 69k). The market was still set to offer up another 20x at that point on BTC (1k to 20k) and 100x on ETH ($14 – $1400).
It seemed unreal at the time, but the reality is it happened. Well, same thing here, feels rather unreal that we could have another bull run now, but there are more than a few indicators pointing to us putting a bottom in here.

I won’t share all my sweet sweet alpha, but let’s look at something simple like the weekly Bollinger Bands in the image above and the fractal-like nature of price. There is some striking resemblance between the end of 2016 and now in terms of both.
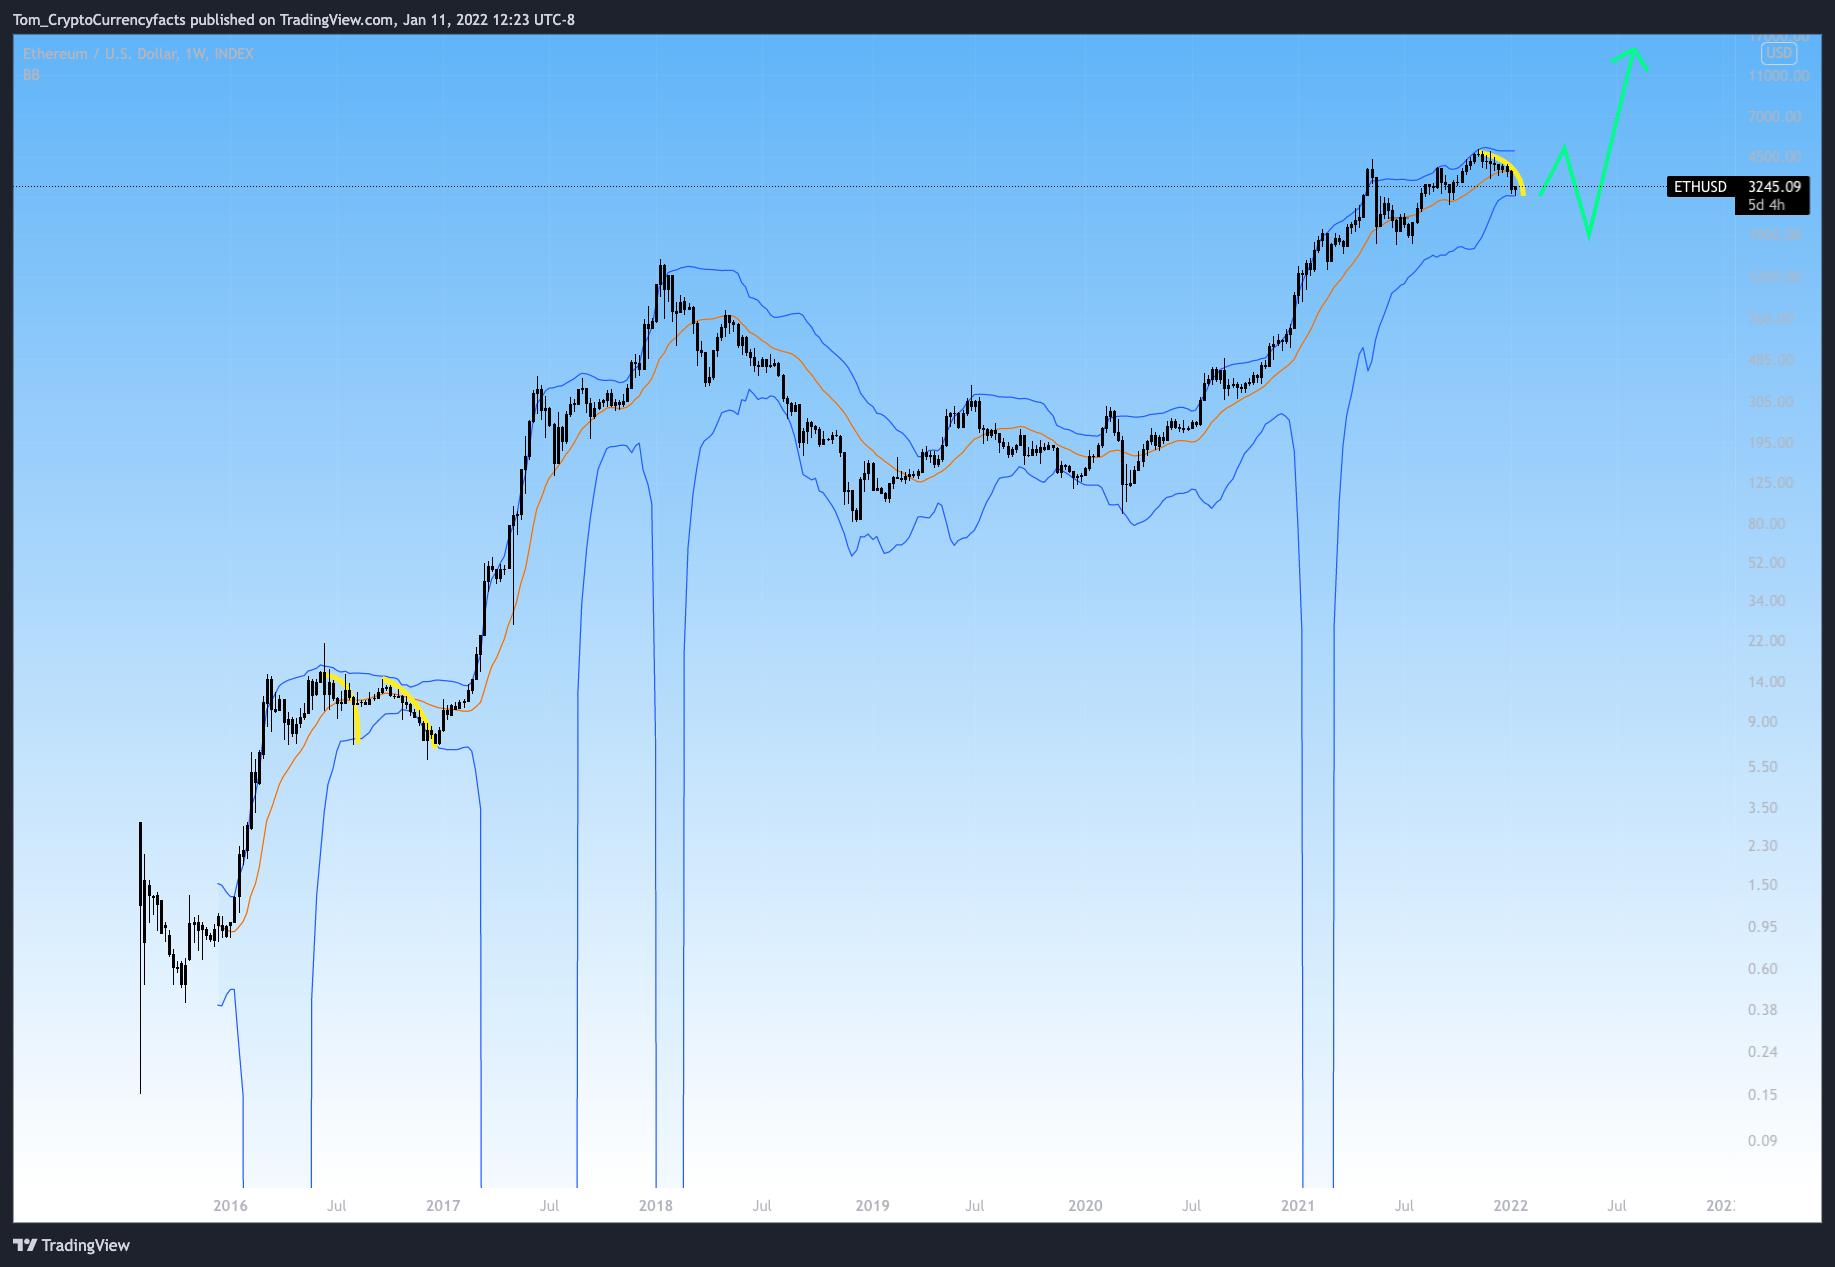
And we see the same thing ETH alone as well as shown in the image below. Even a bearish version of things where we don’t make new highs and then do a mini bear could result in an epic run. Heck, we saw that at the end of 2016 and then again in 2017 before reaching the top with ETH.
If I knew for sure I would be rich. But it is worth entertaining at least. What do you think? Let me know in the comments 🙂

ETH to the moon 2022!?