A Few Bits of Bad News Help Turn the Crypto Bull Run into a Bear
Understanding the Bitcoin Correction of Early May 2018
A few bits of bad news helped spur on a crypto correction that started when Bitcoin failed to break $10k. This included a rumor that the MtGox trustee had moved a 8,000 or so Bitcoin onto the exchanges, news of a raid on the popular South Korean exchange Upbit, and to a lesser extent the potential of regulation of ICOs in the US.
- The main thing that happened is a matter of price action and market cycles: Bitcoin went from $6k to nearly $10k in less than a month, alts and Ether ran just as hard if not harder, momentum started to slow in the high $9ks for BTC (especially alt momentum slowed at that point), RSI was in overbought territory across many cryptos, Bitcoin failed the psychological $10k, we saw an expected correction, it is crypto so that correction was deep, etc.
- However, this price action was accentuated by a string of bad bad news: First we heard Ether and ICOs might be securities and that there was an SEC meeting (this was announced during the bull run and was ignored at first, but the meeting happened to take place right after BTC failed $10k), the MtGox trustee is potentially still selling on the open market (this could be a rumor), and the on May 11th Upbit was raided (this seems real, but the details are sparse).
That should help anyone wondering what the heck is up with crypto this week, and especially today May 11th, to make some sense of it.
The thing I would say is this, the correction was harsh, but was somewhat expected, those who expect corrections like this do so because they expect prices to move in waves (especially in a volatile market like crypto).

Psychological levels like $10k and “the $6k double bottom” tend to work as resistance and support levels, and crypto tends to take the path of least resistance when it isn’t defying odds.
So, while we may be tempted to explain away the price action using stories and events, the core of what is happening is something you should expect and try to tune into as you invest in, use, or trade crypto. That is, markets move in waves and cycles, and this natural tendency is magnified in the volatile crypto markets. Crypto tends to move faster than other markets and make big moves in both directions.
Things like moving averages and RSI can help us to better understand how aggressive we should be with buying or selling, but there is no perfect recipe for getting it right every time.
In general, in times like this, the best advice is to not panic and to stick to your strategy. Any strategy that doesn’t involve moving between cash and crypto, and instead just involves investing in crypto, must involve bearing through bear markets and HODLing through bull markets to some extent (be they short term trends or longer term ones).
There is no way to both invest in cryptocurrency for the long term and to avoid the monthly / bi-monthly large price movements in either direction. Meanwhile, reacting to the news of the day tends to make the most sense for day traders, because as quickly as everyone panics over a specific set of events, just as quickly the trend changes and no one cares anymore.
The only certainty in crypto is that we will see more big ups and downs, and that those big ups and downs will be paired with stories that attempt to explain the price action.
Trying to spot these things in advance or reacting as they happen can be a solid move, but reacting too harshly after the fact is generally a recipe for things to go wrong.
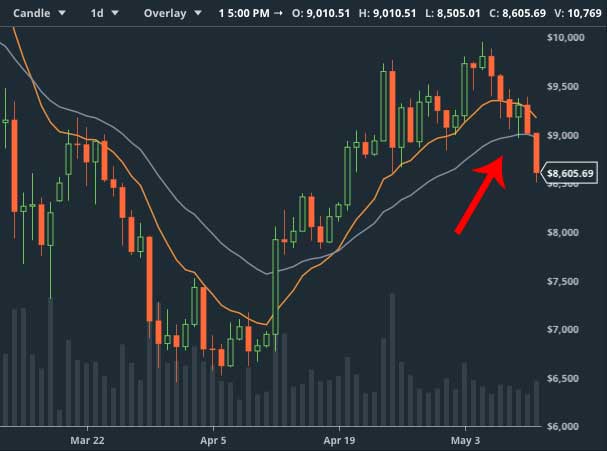
All that said, if you look to the chart at the top of the page you’ll see a chart with “candles” that represent a day worth of price action on Bitcoin and two lines that represent a longterm (26 day) and short term (12 day) moving average (see an article on how to understand the 12 and 26 exponential moving averages on Bitcoin).
The gist of what that image is telling us is this: As long as the price action stays above the orange line (the 12 day, short term) in an uptrend, Bitcoin is bullish. A pullback under the blue line (26 day, long term) in an uptrend is bearish. As you can see we have potentially just crossed into bear territory. The longer that is true for, the more of a trend it becomes. If it remains true, the orange line will cross under the blue line and this will then help to confirm the downtrend. That is a process that takes time to play out.
While reacting to a bit of bad news too late is generally a bad move, and reacting to the formation of a trend too early can be a bad move as well, it is important to be aware of these things so you can react with logic and not emotion as things play out.
It wouldn’t be uncommon for us to see a few weeks of bearishness after a bull run like the one we just had. On the other hand, it is historically just as common to see a retest of the previous high ($10k BTC) after a move like this. Further, the break under the long term moving average on the daily happened less than 24 hours ago, and if the price were to recover today, it would essentially negate the entire bear trend and just create a very long “wick” on the daily chart (which would actually be a rather bullish sign, as it would suggest buyers were willing to buy the dip).
Meanwhile, all that covered, crypto doesn’t have to follow any sort of pattern or logic and it doesn’t have to react to overarching trends. Ultimately supply and demand drive crypto prices. Events and algorithms might have a lot of control over the market, but ultimately the market is a fluid thing and anything can happen.
TIP: If you do want to play this market, the following might be worth considering: 1. If you are in crypto for the long term, but have cash on hand, it can make sense to build an average position at an average price. Here you wouldn’t be overly concerned with the price action of the day, you would just be looking to make sure you got some buys in the lower your price (if your price is higher) while keeping cash on hand if the downtrend continues. 2. If you are day trading for the shorter term, up until this point, still right now based on their charts, and speaking to coins on GDAX (that which the above chart is most relevant for), Bitcoin Cash and Ethereum have been more bullish than Bitcoin and Litecoin. Thus, they have tended to be good bets for playing the bounce (trying to time the bottom and then quickly selling for a profit), meanwhile Bitcoin and Litecoin have been lagging a little making them decent plays if crypto seems to be in recovery mode but you missed the Ether and Bitcoin Cash bounces. Remember though, trends can change on a dime. For all we know the next cycle will see Bitcoin go up and all other coins continue a downtrend or vice versa, it has happened before.
Bottomline: The exact moves a person makes are their own choices, and they need to be based on personal analyses, goals, tastes, and tolerances (i.e. this is not investment advice). However, it can be helpful to hear a range of opinions on what people perceive to be going on based on historic trends. I’m far from the world’s best trader, but writing about and researching crypto every day over time has helped me to spot historic trends and glean advice from other wiser people. This is my attempt to share where we are at for the day, from my perspective, based on what I’ve experienced, to whatever degree that helps. Feel free to add your thoughts by commenting below!
Author: Thomas DeMichele
Thomas DeMichele has been working in the cryptocurrency information space since 2015 when CryptocurrencyFacts.com was created. He has contributed to MakerDAO, Alpha Bot (the number one crypto bot on Discord),...
Thomas DeMichele's Full Bio