Adam and Eve Double Bottom For 2018 on the Weekly?
2018 Adam and Eve on the Weekly?!
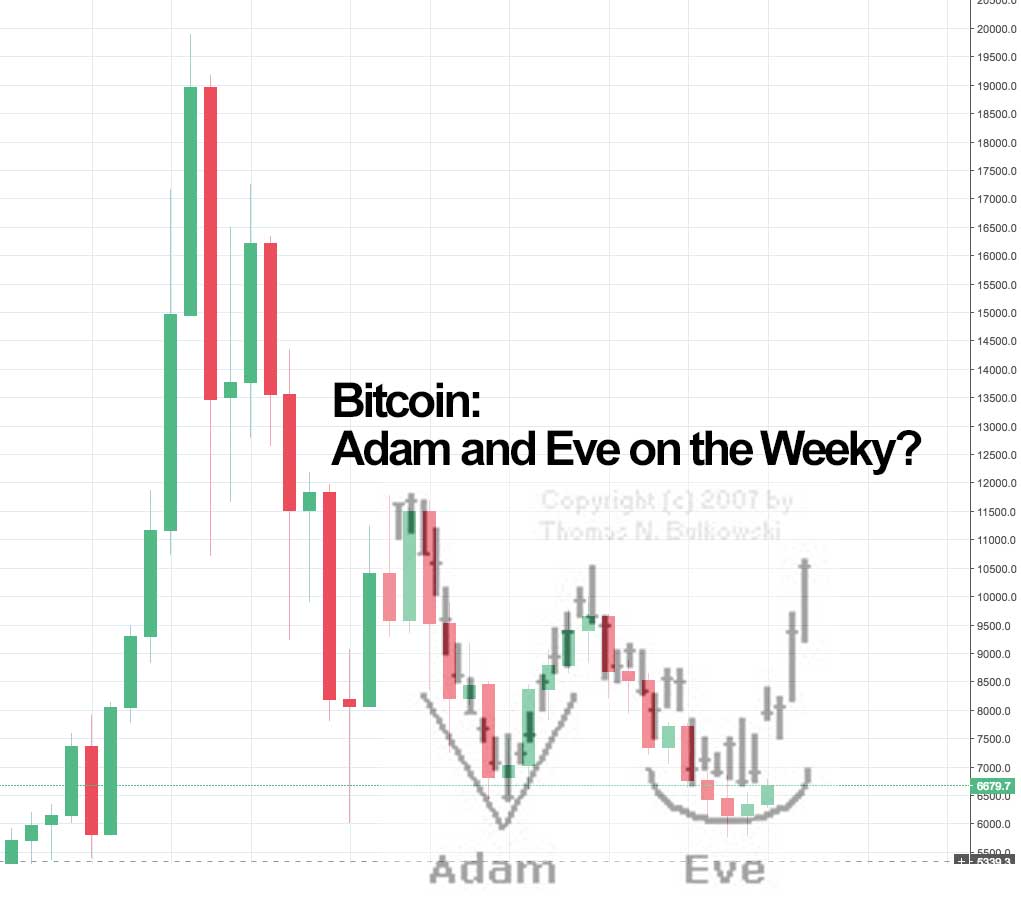
Could Bitcoin be forming an Adam and Eve double bottom on the weekly chart for 2018? If it does it would be one epic reversal.
Speaking very roughly, a move like that could take us to somewhere between $10k – $12k if it played out like clockwork (that is a big “if”).
Then, a move like that would give us one more shot at the moon for 2018. Fun stuff to think about.

NOTE: We are still in a bear market for 2018, and things look rather bleak. We are talking about a potential reversal pattern, not a likely event. The reality is the odds are stacked in favor the bears right now AND crypto is a risky investment in general. So keep those points in mind.
What is an Adam and Eve Double Bottom? An “Adam and Eve Double Bottom” is when the price of an asset bottoms out at the same point twice in a row, but with the first bottom being “V” shaped (Adam) and the second being “U” shaped (Eve). This then forms a “W” (like this: “VU”) Confirmation comes when the middle of the “W” (the “^”) is surpassed. This is a reversal patten and it tends to play out more at a yearly low (like we have in BTC) statically speaking. Consider, the last rally in April looked like it was forming an Adam and Eve Double Bottom on the daily chart (it didn’t fully form). Here I’m seeing something much more significant then that last one though, I’m seeing an Adam and Eve Double Bottom on the WEEKLY chart (the higher the time frame, the more significant a reversal is… and a reversal past $10k on the weekly could actually jumpstart a new bull market)!
NOTE: I’m analyzing BTC, but I’m really speaking to the entire crypto market, market cap, alts, BTC, ETH, etc… all of it on average. All crypto has essentially moved together since the January correction, thus it all has a similar pattern. Meanwhile, if BTC moves up, I would expect all of crypto to rally. It doesn’t always work that way, but it seems to be the current trend. Thus if this pattern plays out, it should result in a market-wide rally.
Disclaimer
The above said, here is the deal, I don’t like to make predictions on this site. This is a “facts about crypto” site meant for educational and informational purposes. This is not an “invest like this” site.
So, while I like to share insights and offer rough sketches, I don’t like the idea of those insights being mistaken for investing advice. This isn’t just about the legal ramifications of offering random free investing advice on the internet, it is about my area of interest being more on the crypto side than the trading side.
I am honestly not a great trader, more like a HODLer and a dabbler if anything.
My only real advice with crypto is don’t play with more than you can afford to lose, cautiously build an average position if you want to be in crypto, and be ready to see your coins go to zero (or at least down 90%+… that is real, it happens).
Still, I have eyes, and I have been looking at crypto charts for a while. And thus I do, all that covered, have some insight… and that insight is best illustrated on charts.. and those charts have numbers on them. Just kind of how charts work.
Anyway, in terms of having eyes and looking at charts, I can’t help but see a rough Adam and Eve double bottom forming on the weekly chart.
Proving the Potential Pattern
I literally copy and pasted Thomas Bulkowski’s Adam and Eve Double Bottom example from thePatternSite.com on top of Bitcoin’s chart. They match. That is the TA, that is the proof. You are welcome.
That covered, here is more insight.
Looking at 2014
If this plays out it would actually correlate nicely with 2014 in the sense that in 2014 Bitcoin looked like it was dead, but then had an epic rally in May that sent it back up to the top of the last rally attempt (see the image below).
I had originally thought the big bump we got in April / May 2018 was to be equated with 2014’s US tax time rally (the little bump in April), but theory expects perfect patterns and perfect dates.
What if its a bit more complex and that May move is actually what comes next?! Notice it was in April – May that BTC broke down from a symmetrical triangle of sorts after hitting a triple bottom of sorts.

Let’s Also Consider the Triple Bottom Descending Symmetrical Triangle Type Thing, The Potential Inverse Head and Shoulders, the I Was Actually Lower Before this Rally Started RSI, etc
In short, because I’m growing weary of writing an article few will read on the 4th of July here… There are a few other patterns on higher time frames that are standing out.
Most of these we can see on the daily (open up Trading View and look).
The Triple Bottom Descending Symmetrical Triangle Type Thing: Look at 2014, see the three bottoms leading up to April? Look at 2018, see the three bottoms of Feb, April, and June? I’m comparing those. In 2014 this structure broke up in May 2014 after it looked like the traditional symmetrical triangle had failed in April 2014. NOTE: If you look at the long wicks, but ignore the really long red one, it forms a symmetrical triangle in 2014 that doesn’t break down until September. If you don’t look at the wicks, then it forms this sort of descending symmetrical triangle type thing, more like the one we see today in 2018.
The Low RSI: Go on Trading View and look at the RSI on the daily candles. It is a bit higher than it was at $5.8k… that is only logical. However, there is still room to run. Plus look at 2017, RSI was overbought for like half the year.
Potential Inverse Head and Shoulders: On the daily chart (from 6-13-18 to 7-4-18) it currently looks like an inverse head and shoulders is forming. If that pattern plays out it could be the spark needed to jump start the next part of our Adam. See what I mean here (if that plays out, it also forms our Eve).
Bollinger Bands: It just bounced off the bottom of the bands, the top of the bands will get us into the $7ks. That again is the type of jump start we need to form the Eve.
Higher Lows and Higher Highs: Since the last $5.8k Bitcoin has been forming Higher Lows and Higher highs on the 4hr chart. If it can manage not to fail around the $6.75k mark like it did in the $7ks, $8ks, and essentially $9ks it could jump start the other patterns noted above. It is the first thing in the way. Luckily this pattern is the most bullish I’ve seen since the way up to almost $10k in May (so it is a bit hopeful).
Bottom Line
If we can get a little push into the $7ks or high $6ks all it’ll take is a quick run and we’ll have the better part of the Eve formed. Then we have to break that middle “^” in the “W” to confirm the pattern. If confirmed it could take us to the moon.
Man that is a lot of ifs… but like, also my eyes are can’t help but see what I’ve illustrated in the chart and we have these other reversal patterns all stacking up.
So although the bears have been dominating recently, I see a path for the bulls to retake control for the late summer / fall. Let’s see what happens. This is one possible world of many!
The best thing we could probably see is a weekly candle that takes us to $7.6k or so at this point. That would form the first part of the pattern very nicely!
How do we know if this succeeded or failed? In my opinion, since we are looking at a monthly chart there is a lot of room for us to go up down and sideways and to still have the pattern play out. I will consider it to have played out if we make a “U” shape for the Eve on the monthly chart at any point without forming another clear pattern first and I will consider it to not play out if it doesn’t (for example if it just keeps going down). Simple as that. We will be able to see that in retrospect.
Author: Thomas DeMichele
Thomas DeMichele has been working in the cryptocurrency information space since 2015 when CryptocurrencyFacts.com was created. He has contributed to MakerDAO, Alpha Bot (the number one crypto bot on Discord),...
Thomas DeMichele's Full Bio
BourneIdentity
The difference between yoru adam and eve and that of the example, is adam is lower than eve… adam is the low, and eve is the attempt to go lower but doesn’t, and is low eve pattern is of low volatility so not really spikes like adam but more of closed candles. So as you can see its not really an adam and eve pattern formation and thats why it didnt rally. Dec 2018 into jan 2019 seen a adam and eve pattern formation happen, and executed.