Bitcoin 2010 to June 2019
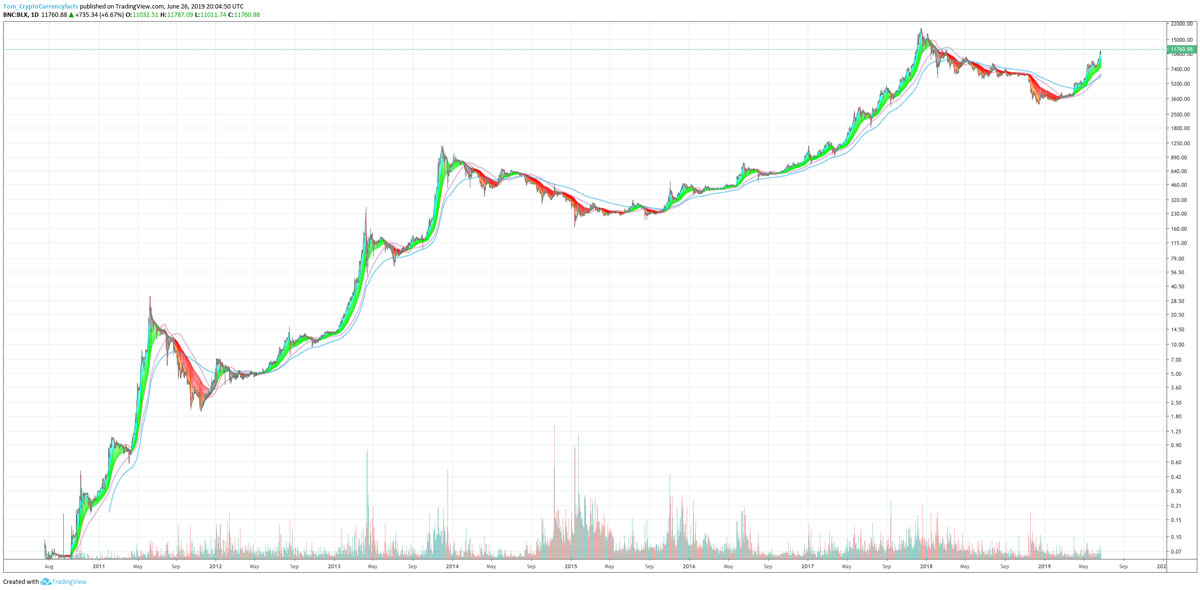
Here is a chart of Bitcoin since it started trading (so BTC 2010 – 2019). This can help you visualize how the recent run looks in comparison to the history of Bitcoin.
Is this run like the 2017 run, is it like the second run of 2013, is it like that run that started in 2012…. or is it like that little run in May 2014?
Who knows, maybe this is different. The idea isn’t to know, the idea is to look with the help of the chart.

TIP: The indicator I’m using is a super guppy (a bunch of EMAs) AKA a ribbon. Specifically this is the very useful TradingView indicator CM SuperGuppy. The gist is red is bear and green is bull. You can see we seem to have entered a bull market.
Author: Thomas DeMichele
Thomas DeMichele has been working in the cryptocurrency information space since 2015 when CryptocurrencyFacts.com was created. He has contributed to MakerDAO, Alpha Bot (the number one crypto bot on Discord),...
Thomas DeMichele's Full Bio