Top 10 Cryptos of Jan 2016 Compared to Sept 2019

The Top 10 Coins of 2016 in Retrospect
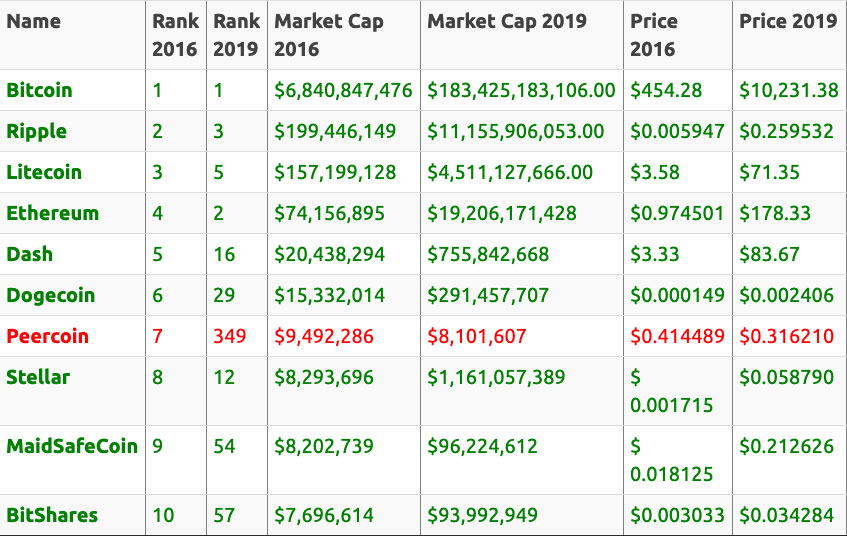
We have compared the top 10 cryptos of Jan 2016 with the top 10 of Sept 2019. This is part of series of posts, for example see the top 10 of 2015 compared to 2019 as well.
Comparing these is one way to test common ideas like “the current top alts must die before the next cycle,” “the current top alts won’t be the same next cycle,” “you can just average into the top 10 and be OK,” etc.
Generally speaking, we simply want to answer the question, “was buying and holding the top 10 in 2016 a good move?”

Let’s look at a chart:
Jan 8 2016 compared to data collected from Sept 10 – 11 2019 (data from CoinMarketcap).
| Name | Rank 2016 | Rank 2019 | Market Cap 2016 | Market Cap 2019 | Price 2016 | Price 2019 | Volume (24h) 2016 | Volume (24h) 2019 |
| Bitcoin | 1 | 1 | $6,840,847,476 | $183,425,183,106.00 | $454.28 | $10,231.38 | $57,064,100 | $14,160,334,901.00 |
| Ripple | 2 | 3 | $199,446,149 | $11,155,906,053.00 | $0.005947 | $0.259532 | $314,079 | $978,739,684 |
| Litecoin | 3 | 5 | $157,199,128 | $4,511,127,666.00 | $3.58 | $71.35 | $2,761,530 | $2,853,518,201 |
| Ethereum | 4 | 2 | $74,156,895 | $19,206,171,428 | $0.974501 | $178.33 | $506,407 | $6,952,533,954 |
| Dash | 5 | 16 | $20,438,294 | $755,842,668 | $3.33 | $83.67 | $92,795 | $184,389,617 |
| Dogecoin | 6 | 29 | $15,332,014 | $291,457,707 | $0.000149 | $0.002406 | $194,366 | $31,205,704 |
| Peercoin | 7 | 349 | $9,492,286 | $8,101,607 | $0.414489 | $0.316210 | $31,611 | $77,049 |
| Stellar | 8 | 12 | $8,293,696 | $1,161,057,389 | $ 0.001715 | $0.058790 | $28,117 | $155,718,664 |
| MaidSafeCoin | 9 | 54 | $8,202,739 | $96,224,612 | $ 0.018125 | $0.212626 | $26,979 | $409,857 |
| BitShares | 10 | 57 | $7,696,614 | $93,992,949 | $0.003033 | $0.034284 | $154,177 | $2,087,344 |
The chart above is pretty clear.
Holy heck, you basically couldn’t go wrong buying any spread of the top coins in Jan 2016 and then holding to today.
The only exception to the above is Peercoin. Still, even with Peercoin you only lost a slight sum, and this of course required you not to take profits at any point in 2017 – 2018.
One notable thing here, euphoria from seeing those sick gains of the past aside, is that even here we can see that for the most part the coins that preform the best are found toward the top of the heap (so Bitcoin and Ripple tend to be safer bets for example).
If I had to have one takeaway here it would be the same as my takeaway for 2015, and that would be “1. the best bet seems to be buying a spread of coins, weighted toward the top of the list, and 2. trying to pick winners and losers is risky.”
Ok, one last thing, let’s compare the above to 2015
Jan 9 2015 compared to Sept 2019 between 12 pm – 12:45 pm PST (data from CoinMarketcap).
| Name | Rank 2015 | Rank 2019 | Market Cap 2015 | Market Cap 2019 | Price 2015 | Price 2019 | Volume (24h) 2015 | Volume (24h) 2019 |
| Bitcoin | 1 | 1 | $3,897,819,781.00 | $183,425,183,106.00 | $284.41 | $10,231.38 | $18,944,900.00 | $14,160,334,901.00 |
| Ripple | 2 | 3 | $636,593,250.00 | $11,155,906,053.00 | $0.02055 | $0.259532 | $1,126,470.00 | $978,739,684 |
| Litecoin | 3 | 5 | $70,250,986.00 | $4,511,127,666.00 | $1.98 | $71.35 | $2,224,230.00 | $2,853,518,201 |
| PayCoin | 4 | 1741 | $48,945,934.00 | $25,725.00 | $3.97 | $0.002145 | $187,475.00 | $7 |
| BitShares | 5 | 56 | $35,507,448.00 | $95,453,544.00 | $0.014214 | $0.034817 | $95,469.00 | $2,274,983 |
| MaidSafeCoin | 6 | 57 | $22,809,682.00 | $94,285,460.00 | $0.050402 | $0.208342 | $4,593.00 | $356,192 |
| Stellar | 7 | 12 | $19,535,449.00 | $1,203,318,018.00 | $0.005483 | $0.060933 | $101,666.00 | $134,781,213 |
| Nxt | 8 | 194 | $16,640,452.00 | $13,954,895.00 | $0.01664 | $0.013969 | $37,146.00 | $667,411 |
| Dogecoin | 9 | 29 | $16,386,823.00 | $295,614,430.00 | $0.000168 | $0.00244 | $320,203.00 | $28,762,958 |
| Peercoin | 10 | 343 | $9,765,897.00 | $8,685,104.00 | $0.44 | $0.34 | $82,782.00 | $86,978 |
Really quick, what you can see is that HODL’ing coins from 2015 to 2016 was also a profitable move for the most part, and while not every coin sticks around in the top 10, and not every coin will enjoy success equal to the next, buying a spread of the top 10 generally seems to be a good move.
NOTE: Nxt lost value from 2015 to 2016, but it remained a top market cap coin for a while. While it looks like in these charts it was a “loser,” it in reality went up over 100x in 2017 for a moment (it is just down to where it started again). Point being, HODL’ers preform well by buying a spread, but those willing to take 100x profits of the table… historically would have preformed even better.