Bullish Divergence on 4hr RSI For BTC and Crypto Cap
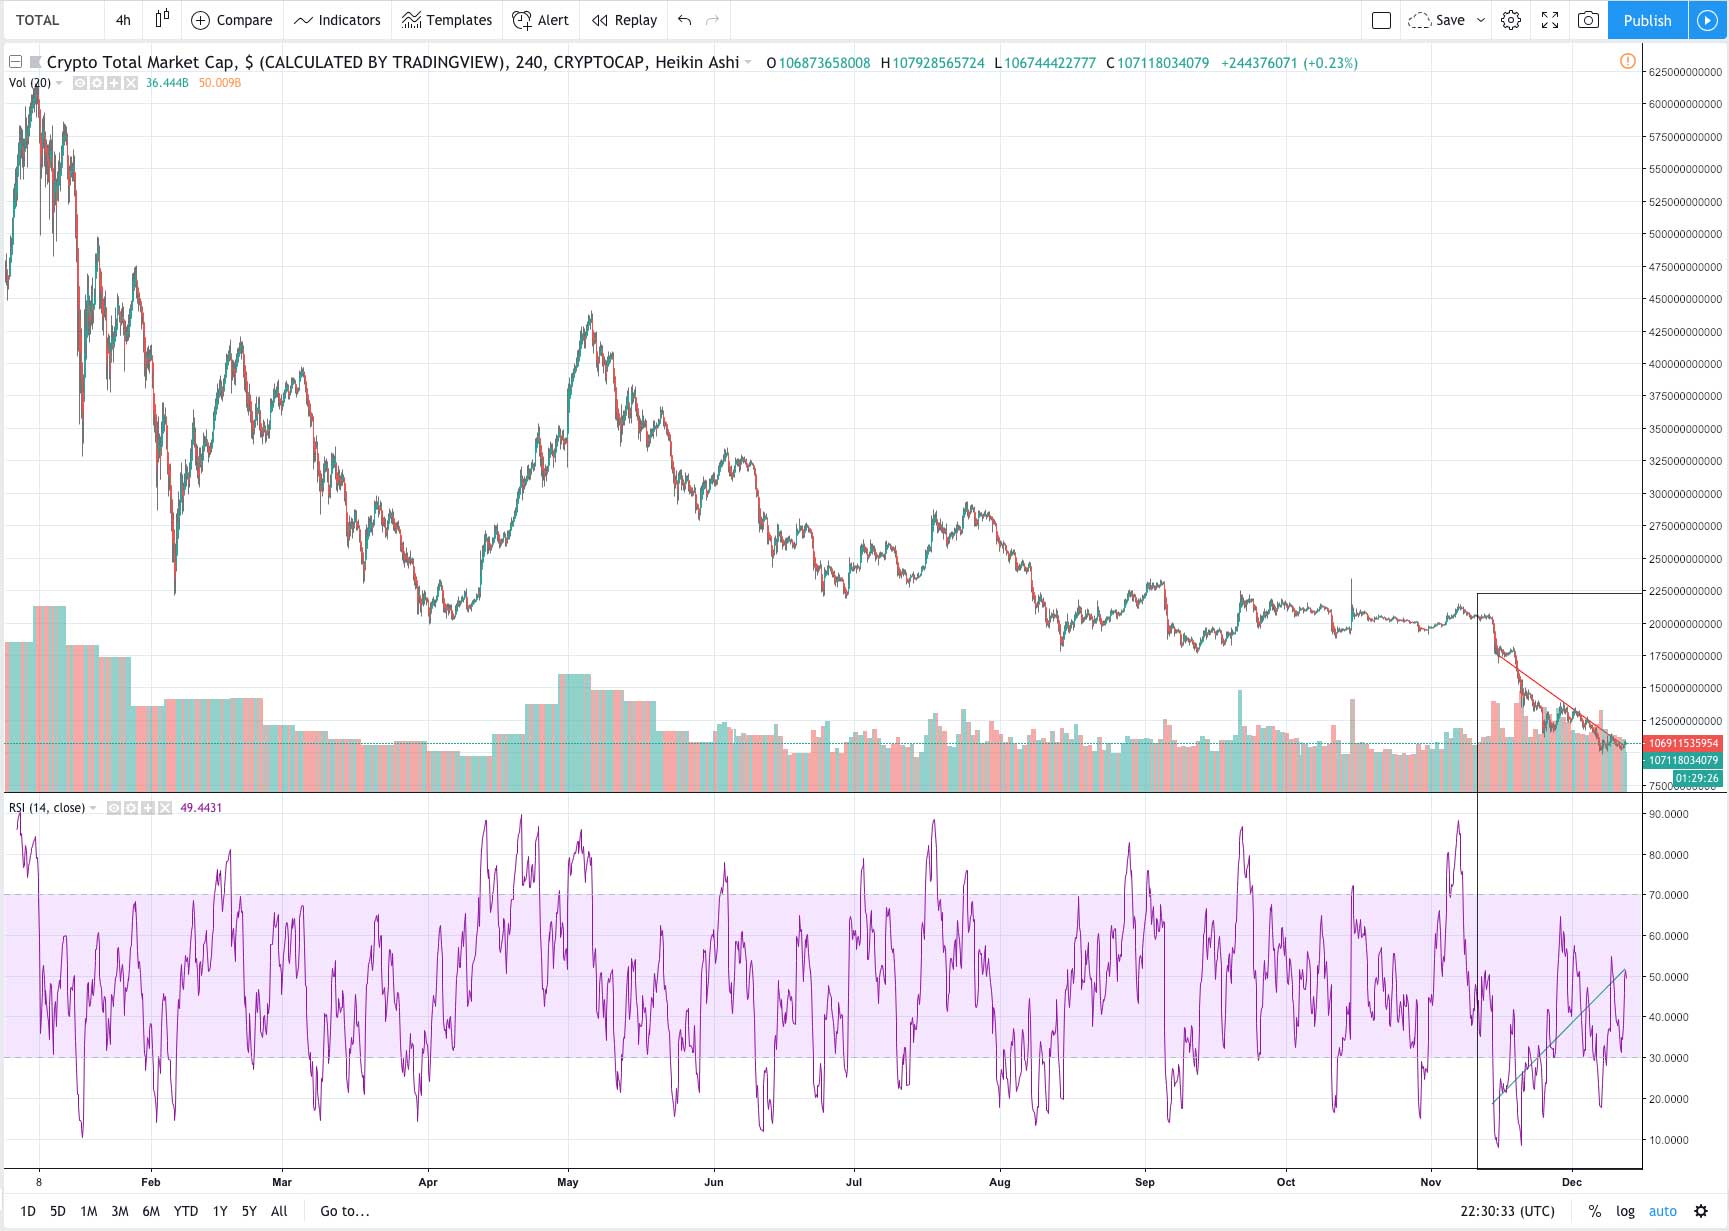
There is a bullish divergence on the 4hr RSI for BTC and the crypto market cap as a whole. This is a bullish reversal pattern found at bottoms… but it is also a pattern that appears in the midst of long downtrends.