What a False Continuation Breakout For the BTC Triangle Would Look Like
The 2018 triangle broke down Nov 19th and it resulted in a 50% drop for BTC. There is however a possibility that this will end up being a false breakdown. Let’s look what a “False Continuation Breakout” pattern would look like in BTC.
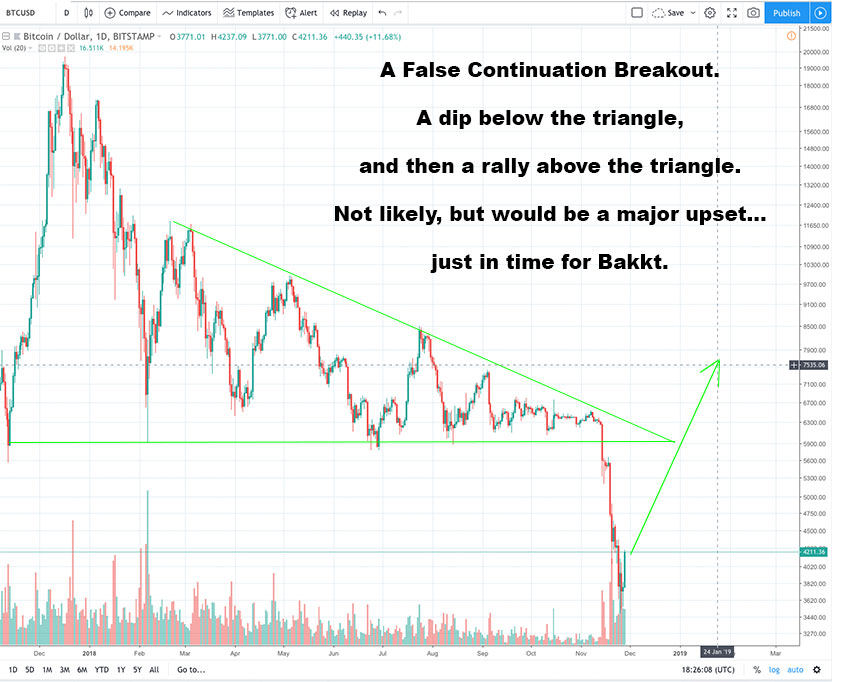
A “False Continuation Breakout” is when a continuation pattern seems to break in the expected direction, but then reverses (it is a continuation pattern that morphs into a trend reversal pattern).
In our case, a pattern called a symmetrical triangle broke to the downside, but it would become a “false continuation breakout trend reversal” if it reversed to rally above the pattern and started a trend reversal from bear market to bull run (see the chart above).
- You can see an example of a false breakout at Forexop.com (scroll down to where it says “Trade setups for a bullish reversal” and see the image that says “symmetric triangle – trend reversal”).
- You can see a top analyst, MPC, on trading view find the pattern himself here (although his analysis might be different, his observation of the setup is essentially the same).

I’ve been talking about the possibility of this type of pattern for a while now, as we have seen a triangle forming for most of the 2018 bear.
Generally a symmetrical triangle that is neither ascending or descending is neutral pattern. It can break up, which is bullish, break down (like it did for us) which is bearish, or do a fake breakout in either direction than reverse.
In a bear market you might expect a triangle breakdown, and in a bull market you might expect a break up.
This was a bear market, so the breakdown, while unfortunate, wasn’t surprising.
Since I knew the potential for the breakdown, I generally mused on what a “fake breakdown” of the triangle might look like.
And, here we are, at one place where such a pattern could form.
If it doesn’t form here there is still some potential to see it… but keep in mind, this occurring at any point would be an “upset.”
The reality is the price would have to nearly double AND breakthrough a ton of resistance (horizontal resistances, moving averages, and the triangle itself all stand in the way) AND then not just fall back down again for this all to work. That is a tall order for 2018 (not for crypto in general, but for 2018 crypto).
To be clear, I am not suggesting anyone place bets based on this (or on anything I say on this site)… Instead I am just trying to document potential patterns on this site as they occur for educational purposes.
I don’t think I’ve written a single article after March 2018 that didn’t denote that “we are in a bear trend.” Meanwhile, general wisdom says “the trend is your friend.”
So, even from an educational standpoint you want to keep those thoughts in mind when looking at long shot and moonshot patterns like this.
It would be crazy to see this all play out, but the reality is crypto HODLers would be lucky to simply see a repeat of the end of 2014 – 2015 at this point. As, I mean, there is no rule that says Bitcoin or any crypto has to continue the long term bull trend!
For more chart ideas, see 2018 compared to 2014.
NOTE: See the charts below, never mind the upset described above… a more realistic goal for HODLers is to hope the market holds steady in 2019 and wards off the longterm bull trend since 2010 becoming bearish.
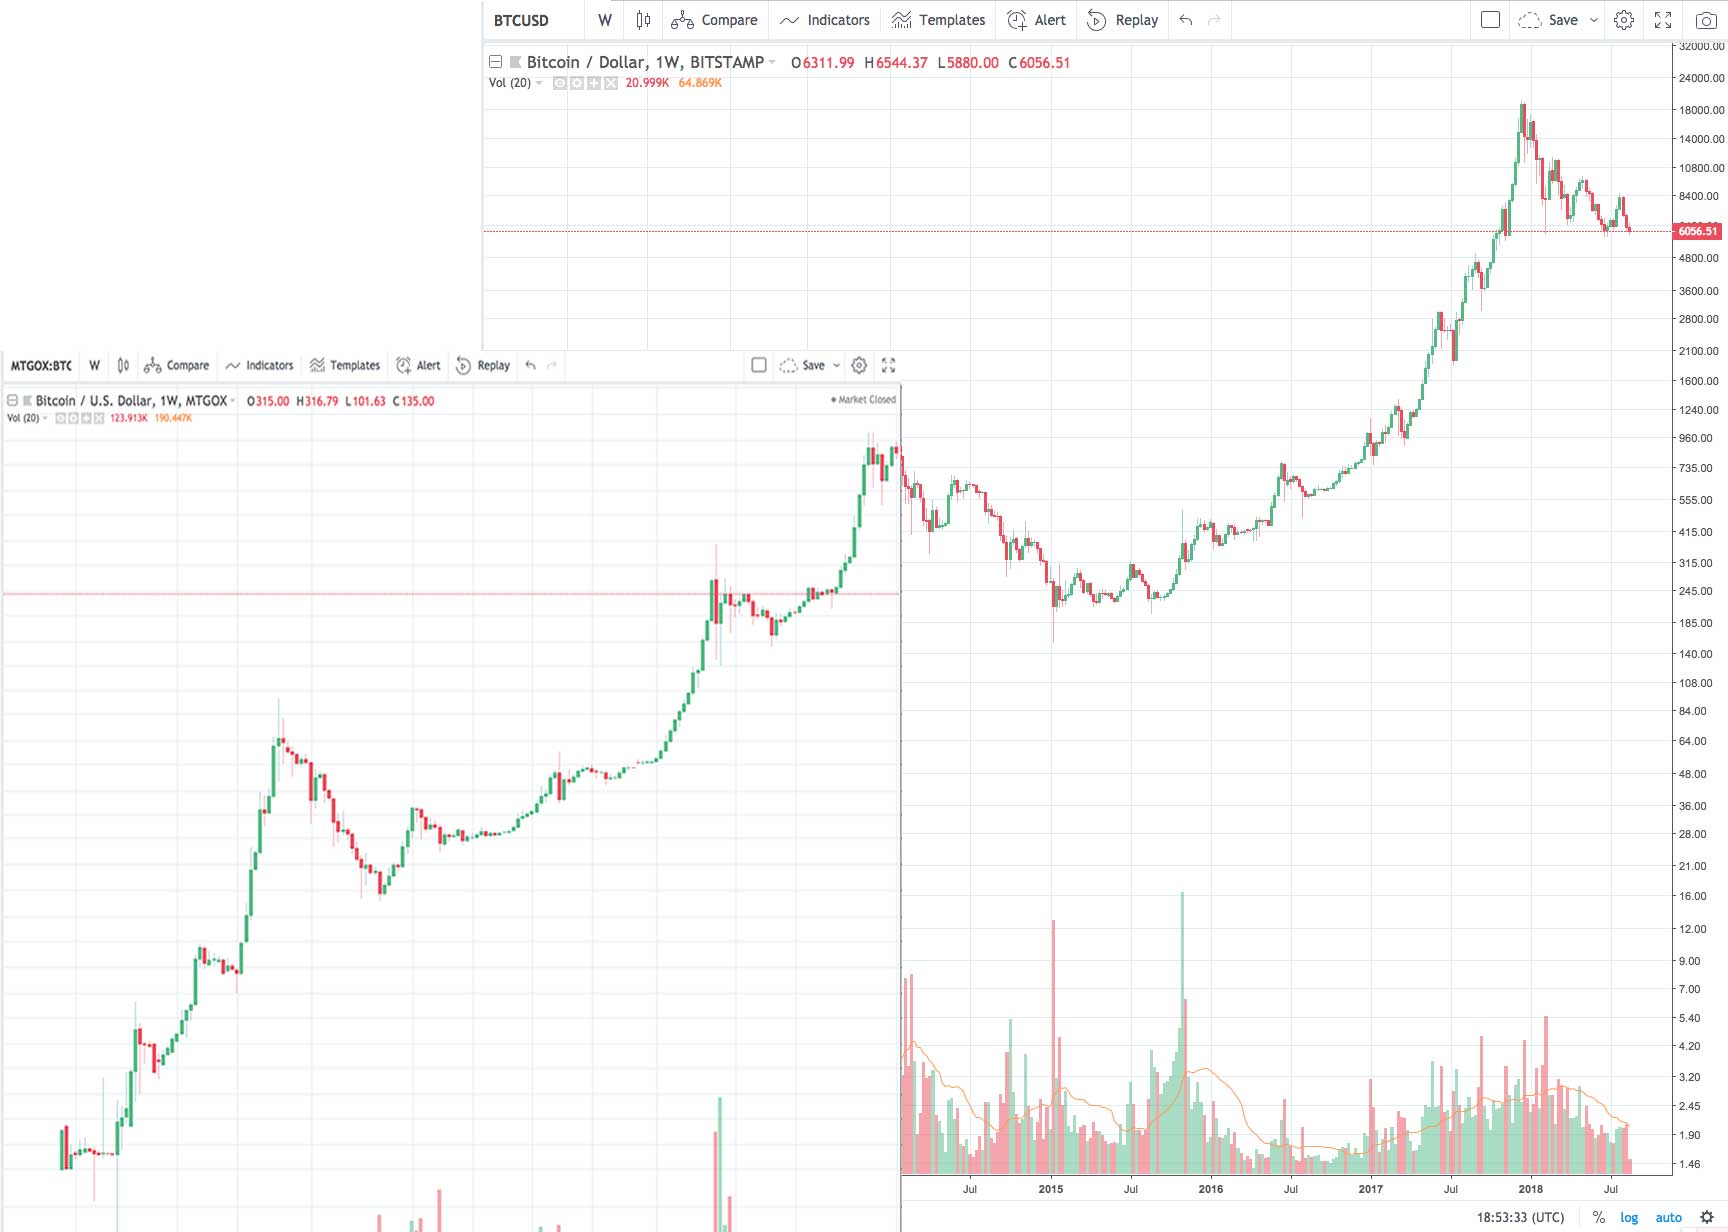
Bitcoin is essentially a bullish log fractal, 2010 – 2018… you know, so far.

If BTC 2018 – 2021 repeated the pattern from 2014 – 2016, it might look something like this.
Author: Thomas DeMichele
Thomas DeMichele has been working in the cryptocurrency information space since 2015 when CryptocurrencyFacts.com was created. He has contributed to MakerDAO, Alpha Bot (the number one crypto bot on Discord),...
Thomas DeMichele's Full Bio