BTC Triangle Breaks Down, or Does it?
BTC hit 2018 lows today, and at first it seemed the overarching 2018 triangle was breaking down. However, the triangle never really fully broke down in both USD and USDT.
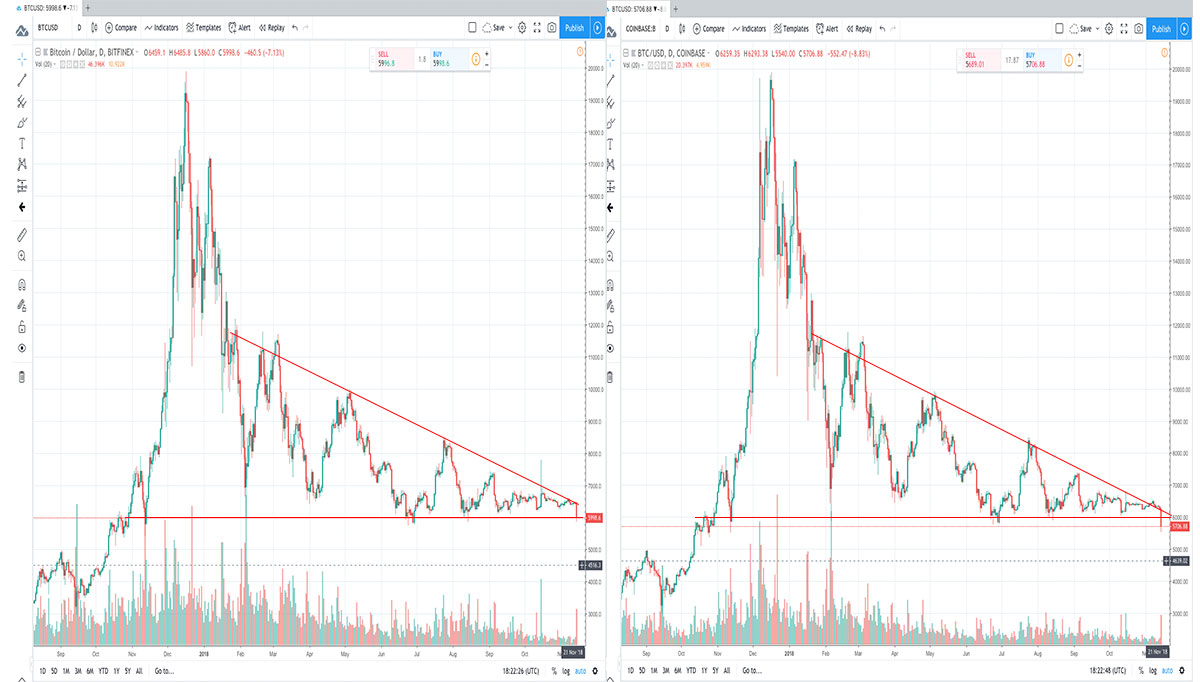
Take a look at the charts above, as of now what happened is the price fell just under the bottom of the 2018 overarching triangle in USDT on Bitfinex (left hand side) and broke the triangle only slightly in USD on Coinbase (right hand side).
Not like a true breakdown can’t happen (heck it could happen before I can finish writing this… UPDATE: it broke down very shortly after this article and then went on to become one of the harshest corrections in crypto history; that said, oddly enough, the fake breakdown pattern is still on the table on higher time frames, so watch for it).

With that covered, it is worth being aware of a type of “fake out” pattern called a false breakout pattern. False breakout patterns can result in trend reversals.
Specifically, let’s discuss a “false continuation breakout” in a bear market. This would be when a bearish pattern seems to break to the downside in a bear market, but then rallies above the pattern starting a bull run (a trend reversal).
I’m not saying that this is going to happen, I am only saying, from an educational standpoint, it is one of the things that could happen in a situation like this (the other more likely thing, as I’ll note below, is… bearish continuation, otherwise known as “going down”).
From the above standpoint, in terms of the article, there are thus two things to watch here:
- The triangle to see if we get a true breakdown (we could always just end up back inside the triangle).
- And, if we do get a breakdown, which seems likely, we would watch to see if we get a bearish continuation pattern or a trend reversal by way of a false continuation breakout.
NOTE: See an example of a false breakout at Forexop.com (scroll down to where it says “Trade setups for a bullish reversal” and see the image that says “symmetric triangle – trend reversal”).
Now with that covered, let’s be clear about the most likely case.
That is that the overarching bearish trend and triangle break down and we find ourselves gradually making our way to the next major support level by way of a series of failed rallies and dead cat bounces.
It is never fun to entertain the bearish case as a crypto holder, but 2018 has been bearish… and that tips the scale in favor of the bears.
It is what it is, those who time the bottom and buy the dip (either in the short term or the longer term) will be well reward, but crypto has crazy risks, especially in a bear market. We all need to make our own choices and manage our own risks, but hopefully being aware of some ways to look at the charts will help you do your own research and make your own choices!
God speed sweet crypto trader, may the charts be forever in your favor.
TIP: A false continuation breakout would look something like the example below. It doesn’t have to happen quickly, it just has to generally be the next major move.

What a false continuation breakout might look like.
TIP: The above is only one way to look at the market, we could have looked at moving averages, bands, clouds, or a ton of other indicators. It’s always good to learn about trend analysis yourself and do your own research.
NOTE: If we do break down, as a rule of thumb you can expect alts to be hit harder than BTC. This means in the worst case, nothing is safe, but potentially you’ll find some very good deals on alts at the bottom. Buying crypto when it’s oversold and then trading some or all of it back is called “playing the bounce.”
Author: Thomas DeMichele
Thomas DeMichele has been working in the cryptocurrency information space since 2015 when CryptocurrencyFacts.com was created. He has contributed to MakerDAO, Alpha Bot (the number one crypto bot on Discord),...
Thomas DeMichele's Full Bio