BTC Did a Very Typical “Bart” (i.e. This is a Good Example of a Bart)
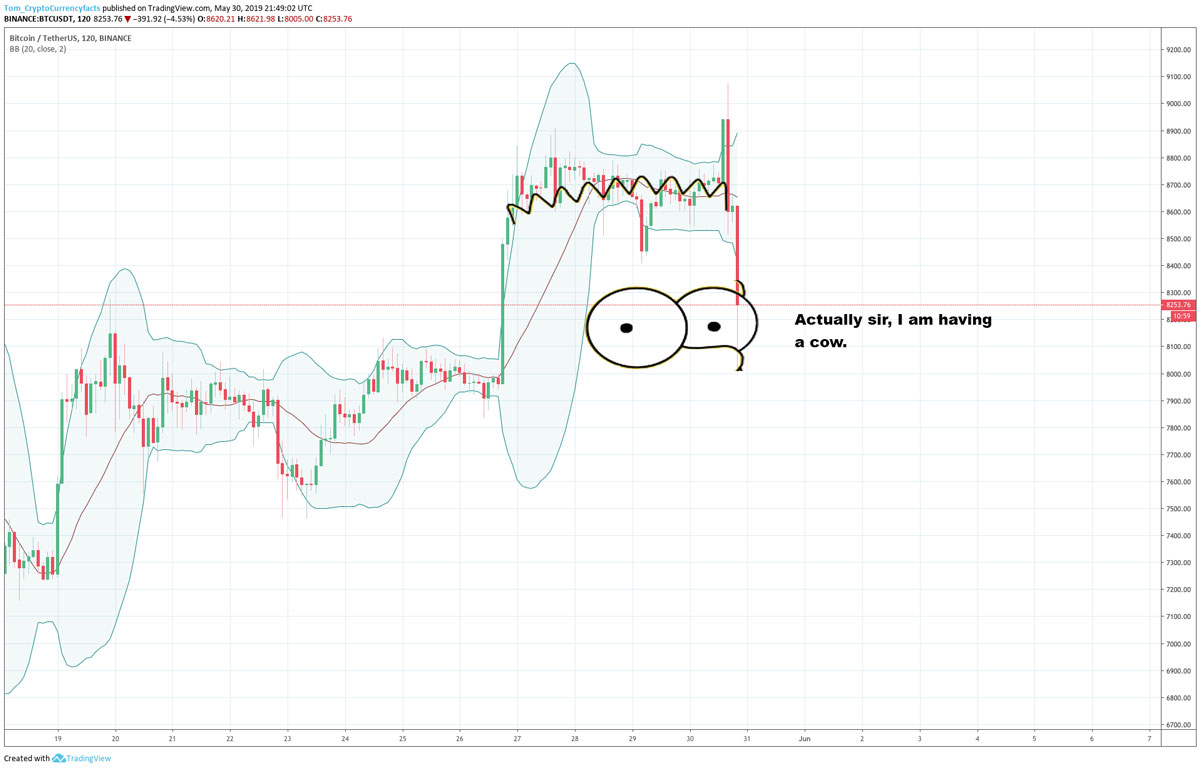
Bitcoin (BTC) did a classic Bart from May 26th to May 30th. A Bart is a crypto pattern that includes one big green candle and one big red candle of equal magnitude.
It looks like this.
The useful thing here is that 1. you can see it coming, and 2. you basically know where to BTFD afterwards.

You can see it coming when the price shoots up with a green candle, goes sideways, and then tries to go up at the end, fails and starts pointing down.
You know when to Buy the F’n Dip (BTFD), when the price has gone back to where it started before the green candle.
The reason you buy the dip (in a bull market at least) is because this pattern is a pretty common bullish continuation pattern when it happens in an uptrend, meaning that in an uptrend it tends to happen before the price goes up more… however, before that, the price tends to consolidate. So if you didn’t buy below the previous range, you often will have time to adjust and get back in.
Author: Thomas DeMichele
Thomas DeMichele has been working in the cryptocurrency information space since 2015 when CryptocurrencyFacts.com was created. He has contributed to MakerDAO, Alpha Bot (the number one crypto bot on Discord),...
Thomas DeMichele's Full Bio