Bitcoin Bubbles Since 2010 in One Image
Every Bitcoin Bubble Since 2010 in One Image
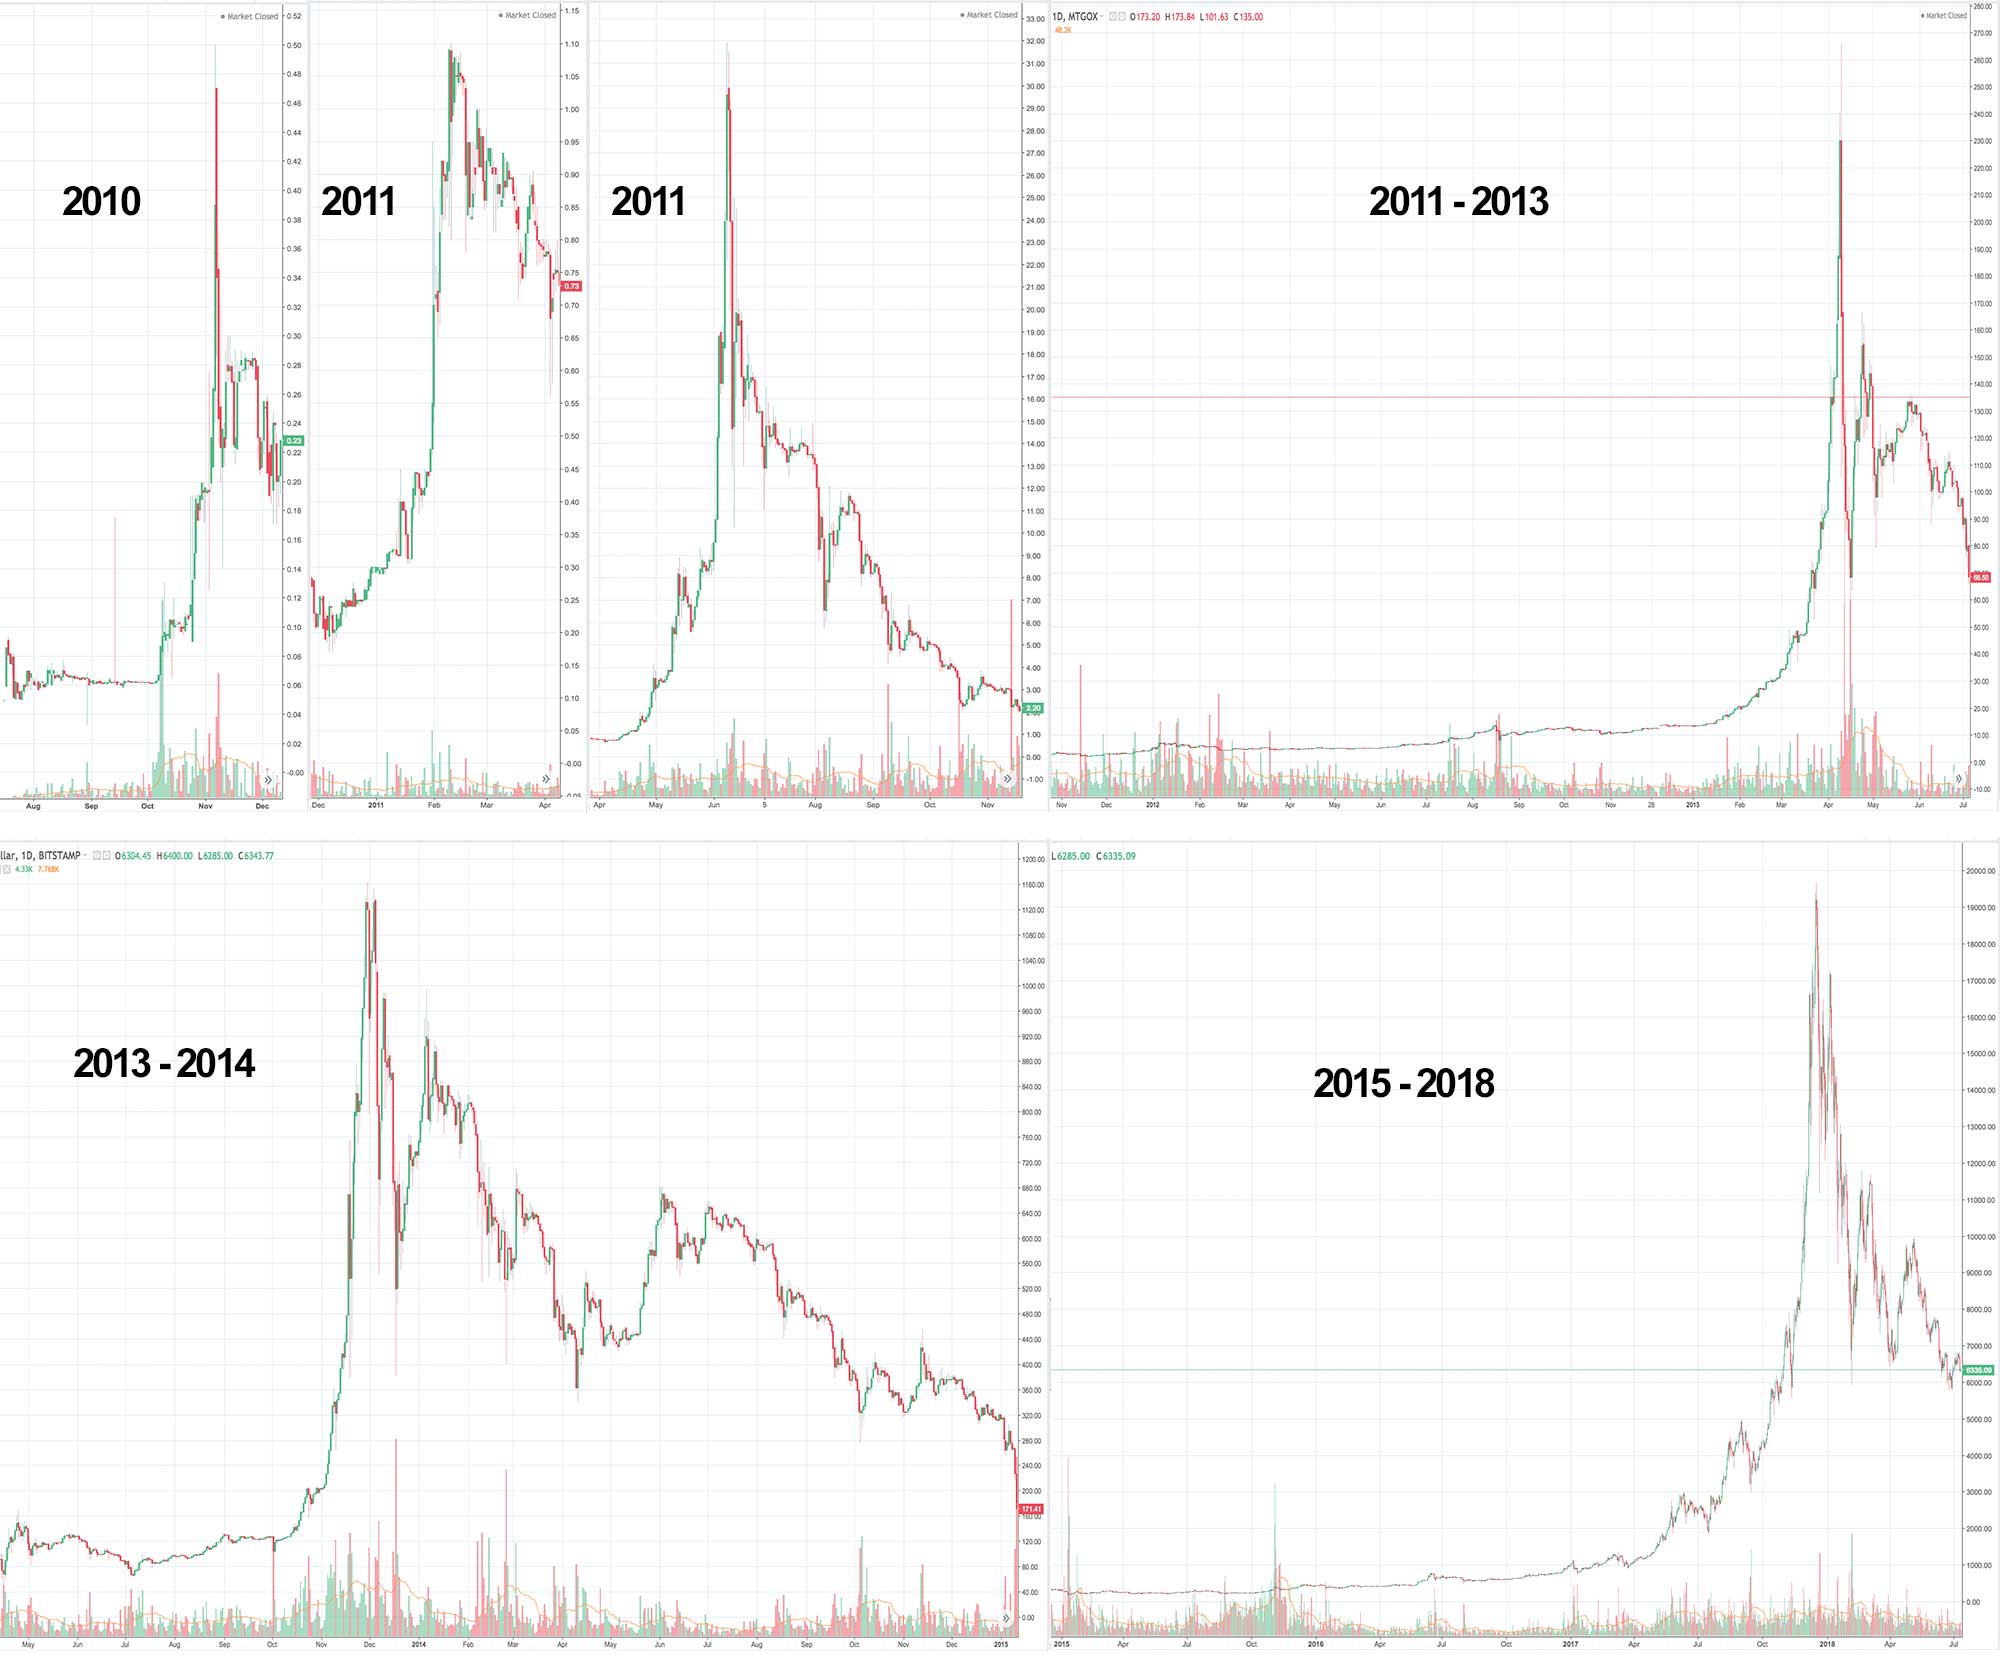
Here is an image showing every Bitcoin bubble since 2010 from one low to the next. This helps one to see how a series of runs and corrections took Bitcoin from $0.05 to $20,000.
Bitcoin Bubbles since 2010. So it has always been like this? Interesting.
Here are a few notes on the charts:
- Bitcoin is a bubble, was a bubble, and really has just bubbled again and again since 2010 in my opinion. Feel free to call those structures in the charts above by any name you wish. The name I choose is the classical term for such things, “economic bubble.”
- This goes until July 11th, 2018. I don’t have a time machine, so can’t go into the future to get future price and volume data.
- The first part uses MtGox data, the second Bitstamp (as those two cover almost all data).
- I couldn’t grab data from before MtGox when Bitcoin was sub 5 cents.
- Each candle above represents a day of price action (they are daily candles).
- In between each major bubble there are a number of significant increases and decreases. I only illustrated major moves of 10x or more. Some of the price action which looks flat only looks that way relative to the new highs that were hit.
- I don’t show other factors like Moving Averages or RSI… but I can tell you RSI has never stayed oversold long (feel free to look for yourself on TradingView).
Here is my takeaway:

Firstly, in its entire history since it was .05 cents Bitcoin has always followed the same basic pattern. That this:
- Trade flat.
- Massive pump with parabolic curve.
- Retrace some or most of the way back (but never all the way), with price action being quick and volatile at first and then slow and less volatile over time and with the correction being more drawn out than the rapid 10x+ increase.
- Repeat.
There may be some magic number or max capacity at which Bitcoin can no longer do this, but if not one could expect this pattern to repeat.
Secondly, to anyone holding bags (i.e. sitting on Bitcoin at a loss) you should consider that in 2010 there were bag holders at .48 cents, in 2011 at $1.10 and then at $30, in 2013 $280 and then $1120, and then in 2017 nearly $20,000.
You might feel stupid and upset for buying a $20k Bitcoin, but in the past your predecessors felt that way for their .48 cent Bitcoin buys. Sometimes it is best to HODL through the bad times and build an average position if you aren’t an expert trader. Consider, if you bought at .05 cents and sold at .50 cents, but didn’t buy again before $1.00, $100, $1,000, you were probably far less excited at $20k than the person who bought at .50 cents and HODL’d until today. One trader is smart on paper and did very well in 2010, the other has $6k for every .50 cents they spent.
Lastly, Probably the most upsetting thing here for a crypto lover is the reality of how each bubble is taking longer and longer to form. Two in 2011, one in 2012, two in 2013, then one again in 2017… It looks to me like as the real dollar value of Bitcoin is going up pushing it up 10x – 30x is getting harder and harder.
Further, these historic charts clearly show that there is room for not only more downside, but a long period of stagnancy after a very slow grind down (TRAPS).
That said, even with all the historic worst cases in mind, there is no precedent for going back to where we started ($500 – $1000) and there is clearly precedent for a 10x – 30x from here.
Yeah, that is right. Basic logic.
Look at the charts, and unless there is something magical about our current $6k or 2018, the precedent from here is 10x – 30x sometime between now and the next few years.
So that is $60k – $180k… which is what the log charts suggest and some of the bulls are calling for their bullish predictions.
Now That isn’t a prediction, heck I don’t even think it is likely. that is simply the sort of logic one might use if I asked this question, “what is ‘x’ in the following sequence ‘1…2…x…4’?” It doesn’t have to be 3, but that is what the pattern is suggesting.
Bottomline: Bitcoin has essentially done the same thing since day 1. I would not be surprised to learn that the same players have been playing the whole time. That human behavior in speculative market is laughably predictable. That some of today’s whales were bag holders at 50 cents or a dollar or whatever. That is, the charts a clearly telling a story here. That story is mostly of bloodshed and sadness… you know, outside of those short periods of time in which we see 10x – 30x. If you are a master, do what you do, enter and exit and leverage and profit good sage… if you are not an expert, you may want to embrace the misery and follow the patron saint of bad traders who do well anyway Master GameKyuubi and pray the pattern plays out again sometime between here and like 2022.
Author: Thomas DeMichele
Thomas DeMichele has been working in the cryptocurrency information space since 2015 when CryptocurrencyFacts.com was created. He has contributed to MakerDAO, Alpha Bot (the number one crypto bot on Discord),...
Thomas DeMichele's Full Bio