Bitcoin July 2018: The Bull Case Vs. the Bear Case
Some TA for July… Great Setups for a Reversal and Bull Run, but Not Much Wiggle Room
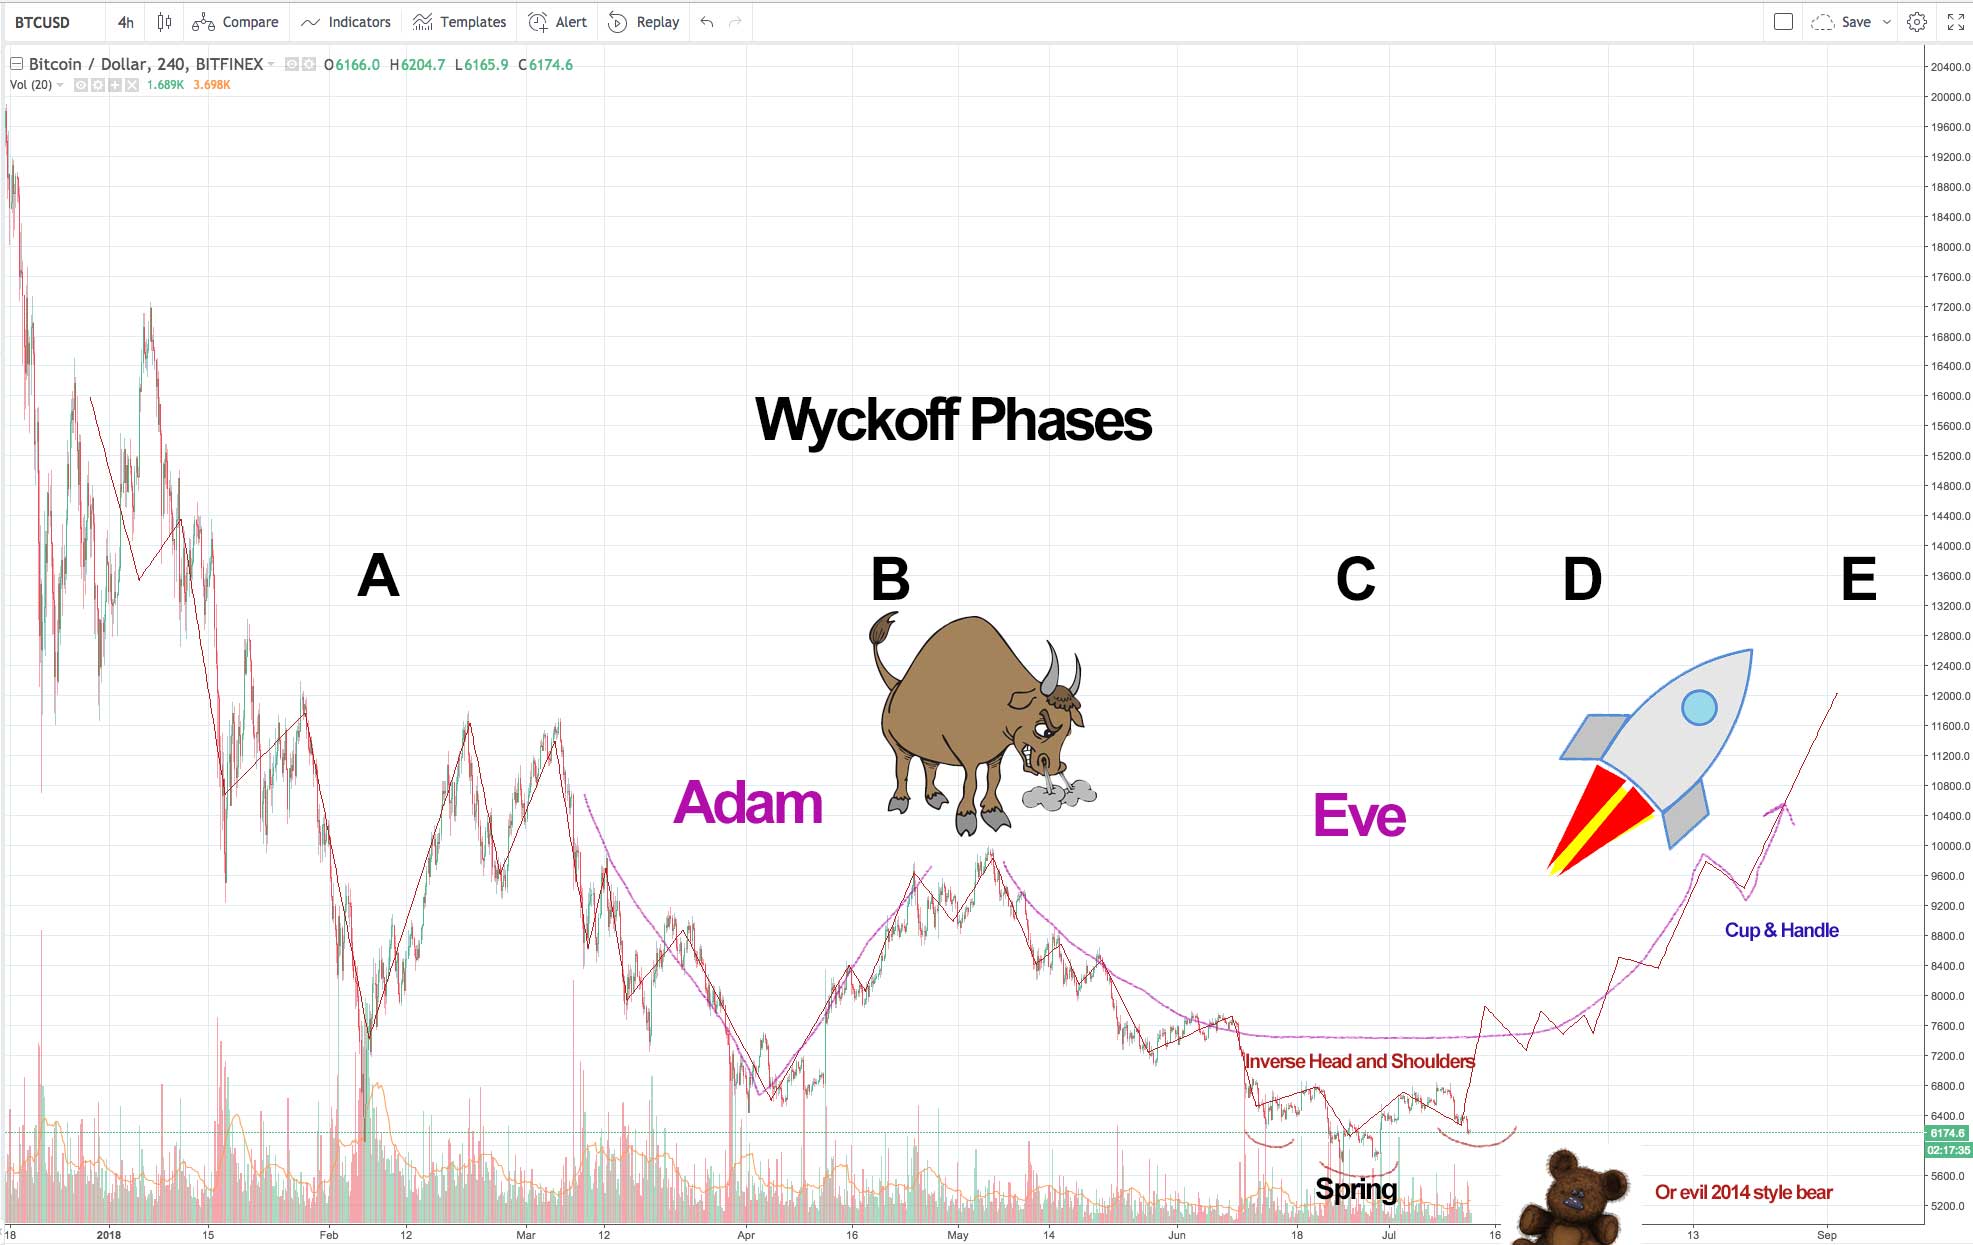
Here on July 12th, 2018 Bitcoin is in a bear market and some indicators are bearish. However, there is also a potential inverse head and shoulders and Adam and Eve forming which could take us back to a bull market. Let’s examine the bull case vs. bear case.
TLDR; We potentially are at the spring phase of a Wyckoff cycle, forming an inverse head and shoulders and an Adam and Eve, at a triple bottom, and setup for a false continuation breakout from 2018’s symmetrical triangle. However, first thing first, we need to form that right shoulder and not drop here… there is, some, but not a lot of wiggle room here. Otherwise we are in a bear trend in the correction part of an overarching Bitcoin market cycle and there is still lots of room for sadness.
NOTES AND DISCLAIMER: The image above shows in pictures what I say on this page in words (please note that the line showing what sort of price action might occur moving forward is a very rough sketch based off of how a Wyckoff cycle should end, how the right shoulder of an inverted head and shoulders, and how the Eve of an Adam and Eve should complete; it isn’t meant to be exact in any respect). Further, none of this is meant as investing advice, it is meant to be educational. The idea is to help one understand pattern recognition in crypto, not to help one place bets. We are in a bear market, so if you want to take a bet you can’t lose on, try staying away from crypto. Meanwhile, if you want investing advice, hire a fiduciary. If however you just want to have some fun talking about possible patterns forming in crypto and/or want an analysis of the state of the market, keep reading.
The Bear Case For Bitcoin in July 2018 Vs. the Bull Case

The Bear Case:
- We are in a bear market and have been since 2018. Market cycles are a thing, and there has been no confirmation that we are at the end of the correction phase. The trend is your friend, the current trend is bear. This gives a ton of points to the bears.
- Bears keep winning outside of a few quick rallies. We had February, April, and a few quick runs in between… but for most of 2018 the bears have been winning. In 2017 it was easy to be a bull, you just threw money at crypto and the money gods made in rain. In 2018 it is easy to be a bear, you open a short without a stop, and go to sleep.
- In a few past Bitcoin bubbles, 2014 for example, they had something that looked like our current set-up (trading flat, low volatility, low volume) and it essentially broke down and we saw more losses.
- On the log scale and on longer time frames we are about to see some death crosses and there is a good bit more room to go down in theory.
- Daily and Weekly RSI haven’t become oversold yet (if we hit 30 RSI on the weekly it would be a bullish indicator, we are a little over 40 right now).
- We are stuck below some key moving averages on higher time frames and many short terms have crossed under long terms.
- Search interest is down.
- Bulls keep failing to break the $6.8k level.
IDEA: If 2018 is like 2014, we could be at a point where we break down from $6k and see another leg down before forming a bottom. Check out the fourth red arrow in the graphic below. A top trading idea on TradingView as of July 15th, who had this idea long after I did (by the way; not that it is rocket science to look at the last major bubble and draw comparisons), suggests that this could take us down to $2,876. For a myriad of reasons (current liquidity, where supports levels are, etc) I would consider that target overly bearish. If I had to give a number that correlated with a move like this, I would offer the obvious next step $4.5k – $5k (not $2.8k – $3k)… as $4.5k is where the next level of support is essentially and $5k is a psychological whole number above that. Then, if that hit, I would reassess from there. That said, the setup is there to avoid more downtrend all together and, if 2018 can be compared to the second red arrow below, a move up could be eminent. A move up like we see after the second red arrow would actually correlate with the bullish idea presented in the graphic at the top of the page. Speaking of bullish ideas, with that all covered, let’s move onto the bull case.

Everything I talked about above with some lines and arrows to better illustrate what I mean. I created this image back when we were in the $7ks. We were potentially at the third arrow at that point. I would now assume we are at the fourth.
The Bull Case:
- We keep bottoming out at around $6k. Bears have really struggled to break that level.
- $6k is essentially the cost of mining a Bitcoin. It helps for miners to be profitable for the system to run… however, low energy costs and reserve capital mean some miners can mine at lower values (and they may even benefit from pushing out competition).
- Bitcoin’s chart looks like a mirror image of the image that comes up when you Google “Wyckoff Phases.” Specifically the current price action looks like the “spring” phase of a Wyckoff Cycle (right before it potentially goes up).
- Bitcoin is currently forming what looks like an inverse head and shoulders and an Adam and Eve (maybe with a cup and handle forming). As we speak the right shoulder of the head and shoulders is forming perfectly (but of course the first part of the formation looks like a dang bear flag). TIP: Ethereum also has a big Adam and Eve showing (considering the top two coins both have that, gotta give points to bulls there).
- I didn’t put it on the chart, but we also have a potential triple bottom (February, April, June- July at $6k). Also, although the symmetrical triangle broke down, we are still roughly in a symmetrical triangle (but one with a False Breakdown and a setup for a “False continuation breakout”; see here).
- 4hr RSI and lower are generally oversold or close to it, that helps the market to find support for the right shoulder. However, RSI on those time frames can change rather quickly and it won’t help for long if we keep going sideways. NOTE: On July 12 this was true, and the right shoulder held. However, a small subsequent rally resulted in RSI edging toward overbought (RSI is reactive and can change quickly on the small time frames, it is very useful for finding local bottoms and tops on smaller time frames, but it only can tell us so much on any time frame).
- MANY alts are sitting at a double bottom where they are back at or around their April lows.
- All of this is lining up at the yearly low… which means the odds of it pointing to a reversal are higher.
Could go Either Way:
- Trading volume is down.
- Trading volatility is down.
Conclusion
Essentially the overall crypto 2018 market is bear and Bitcoin is setting the tone. There is a lot of death crosses and bearishness in terms of Moving Averages and there is no clear signal of recovery yet. However, the overall pattern with its Wyckoff, triple bottom, inverse head and shoulders, Adam and Eve, etc set up offers the bulls a lot of ways out of that bear market.
A conservative investor has to give odds to the bears here, because as I said above “the trend is your friend.” However, those with their eyes on the next bull run have a few reasons to be hopeful. First and foremost in the moment, all eyes are on forming the right shoulder of the inverse head and shoulders.
PRAY!
So, what could take us out of the bear? Well people say institutional investors, and I don’t disagree that this would help. However, that alone isn’t what I personally want to hang my hat on that (since 1. institutions, like futures contracts and storm troopers, generally aren’t your friend as a pleb… i.e. they are just doing their job and 2. one has to assume they are already building positions now and just haven’t put out the press release yet). Instead what we need, in my opinion, is very good news or price action to draw back in some of the retail investors who aren’t trying to time the bottom but instead are likely interested in being there for the next crypto boom.
The crypto boom is coming in my opinion, but more importantly, mass adoption is likely coming. This is just the bear part of a market cycle on the path toward a bright future. The problem is logically we have a lot more room to go down in theory if things don’t pick up here.
To end, check out the image below to better understand how we got from 5 cents to $20k despite the massive corrections that are typical in crypto market cycles. I’m sure people thought it was the end in 2010, 2011, 2013, 2014, etc (and we have all heard calls for the end in between)… but it has never been the end, no reason to assume the whole pattern changes here.
NOTE: Yes 2018 looks like 2014… but it also looks a bit like 2010, 2011 two times, and then 2013 once. In other words, Bitcoin market cycles are a thing and those cycles are what took us to $20k. The question in my mind isn’t “is Bitcoin dead,” it is, “where in the cycle are we?” If those reversal patterns play out, the answer could be “the local bottom,” “the 2018 bottom,” or even “the lowest we price point we will ever see in our lifetimes.”
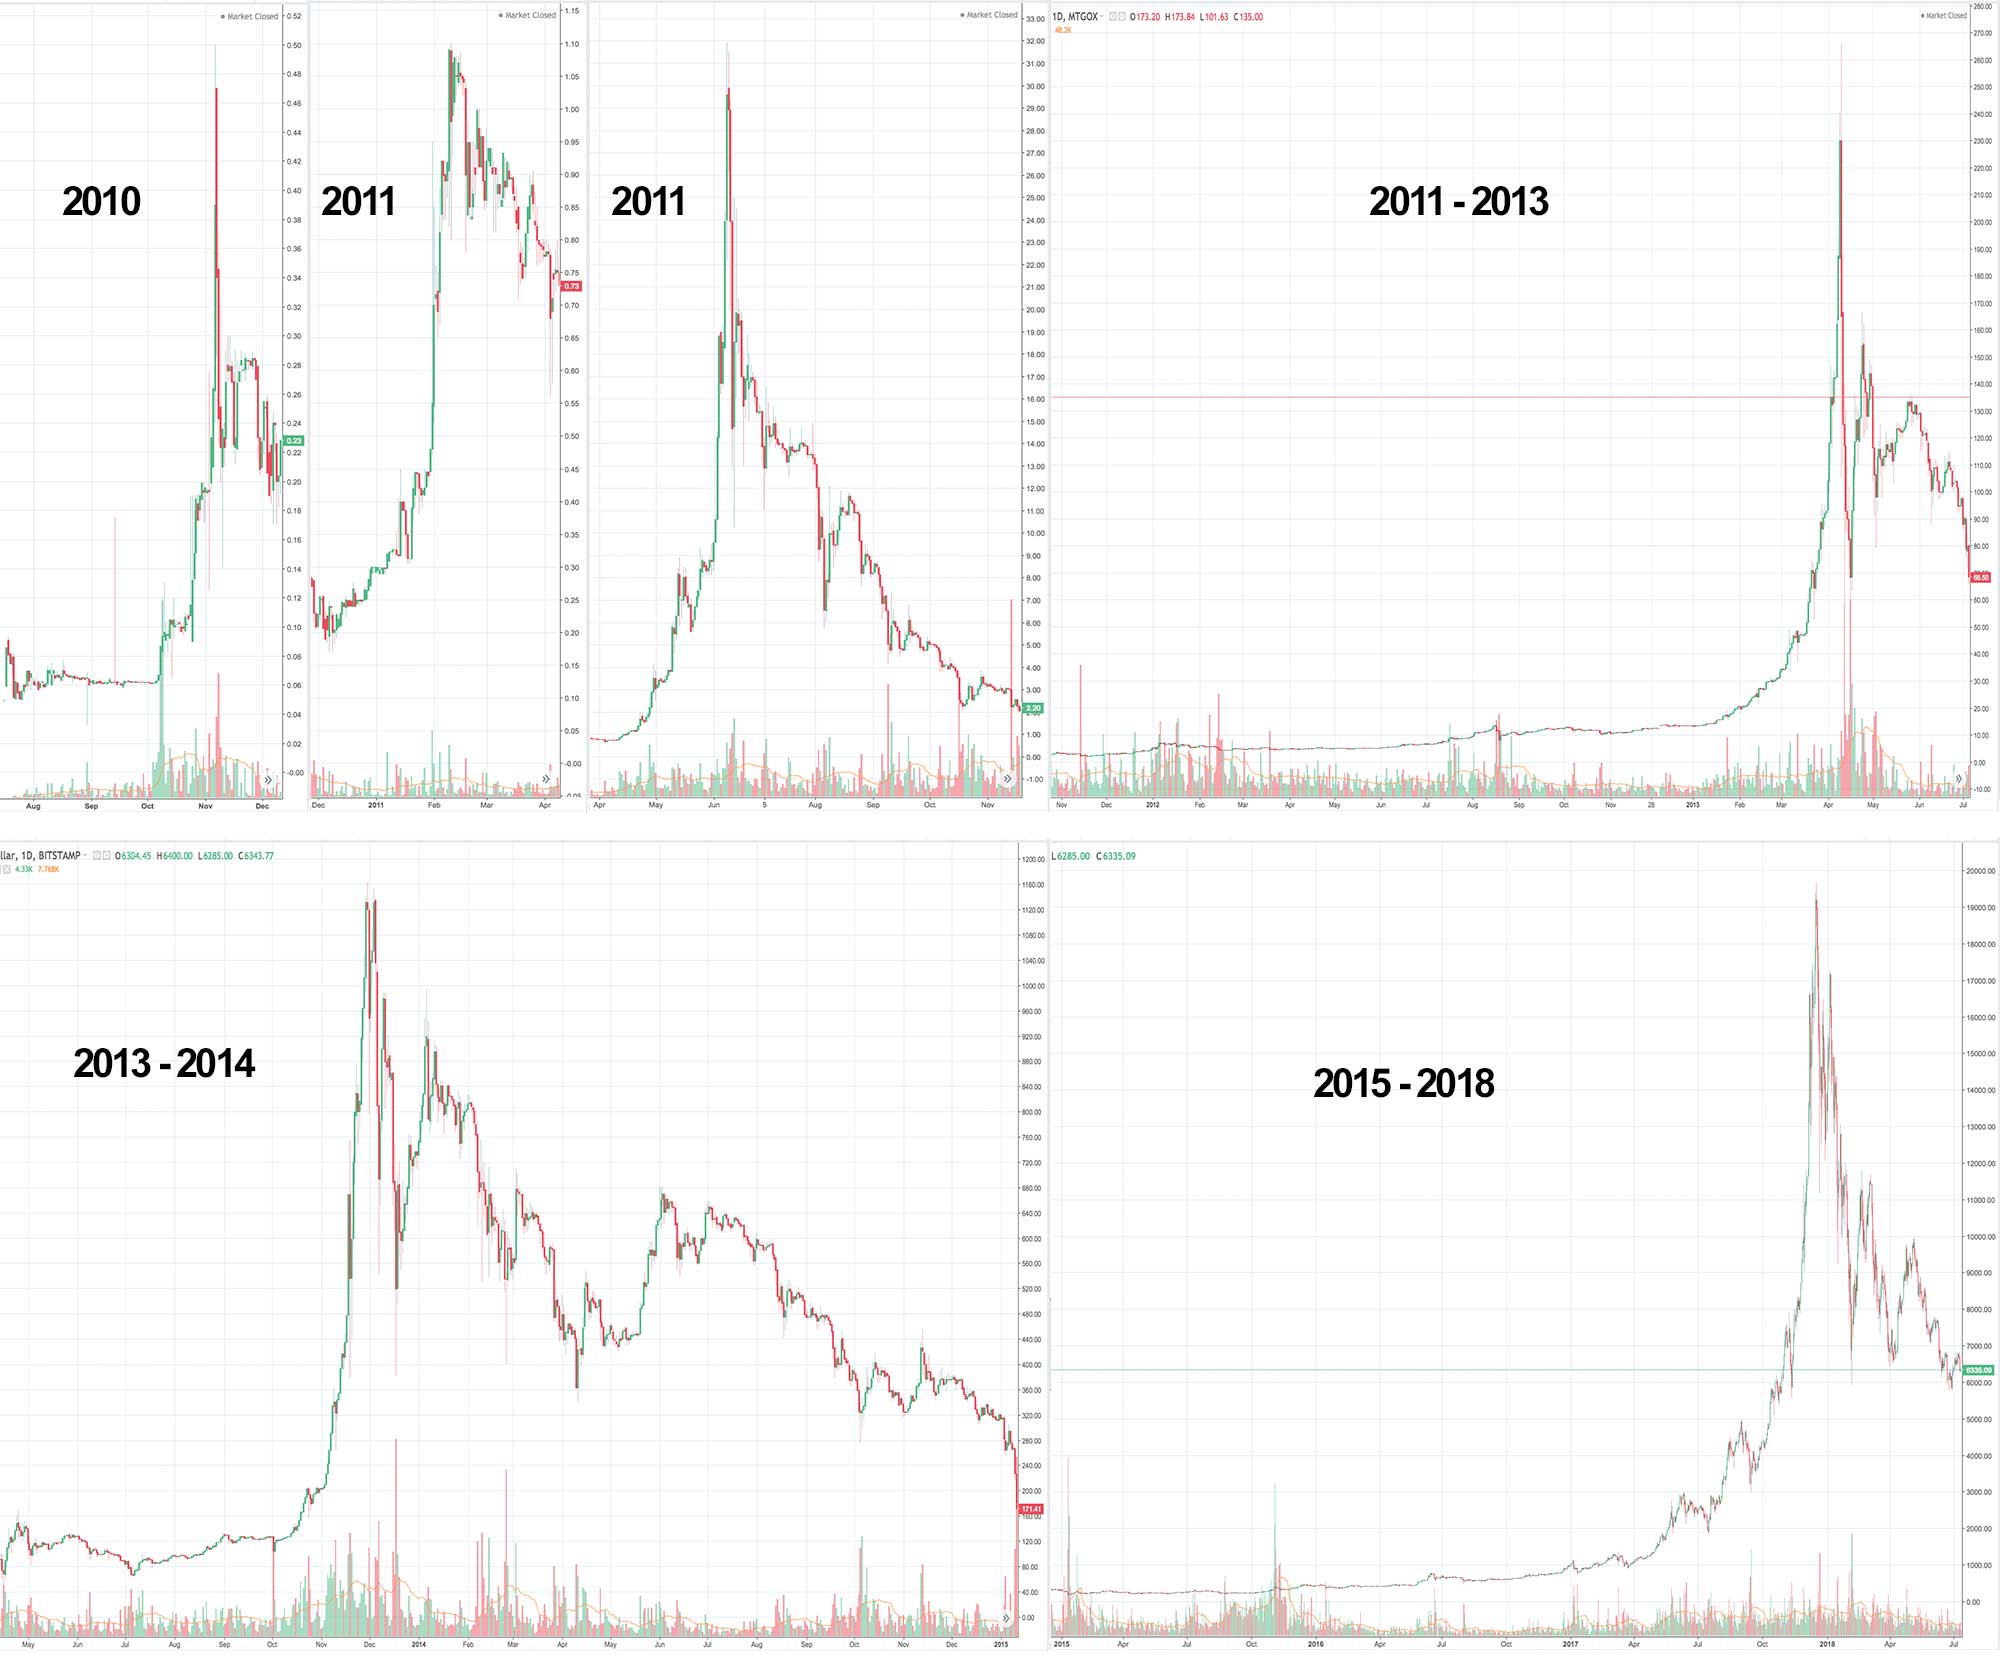
Bitcoin Bubbles since 2010. So it has always been like this? Interesting.
Author: Thomas DeMichele
Thomas DeMichele has been working in the cryptocurrency information space since 2015 when CryptocurrencyFacts.com was created. He has contributed to MakerDAO, Alpha Bot (the number one crypto bot on Discord),...
Thomas DeMichele's Full Bio