The “Bart” Crypto Pattern
The Bart Pattern in Cryptocurrency
There is a pattern so common in cryptocurrency trading that it has been nicknamed the “Bart” due to it looking the head and hair of an iconic character.
For a better understanding, see this Tweet from @TheCryptoDog (I’m trying to keep this educational and informational and avoid any direct references to the character; this page is about the origination of a meme and the related chart pattern for educational purposes).
It is useful to know this pattern in crypto trading because it tends to end in a sizable price decrease following an equally sizable price increase. It is thus full of potential ways to lose money if you aren’t careful (or to potentially make money if you know what to look for).

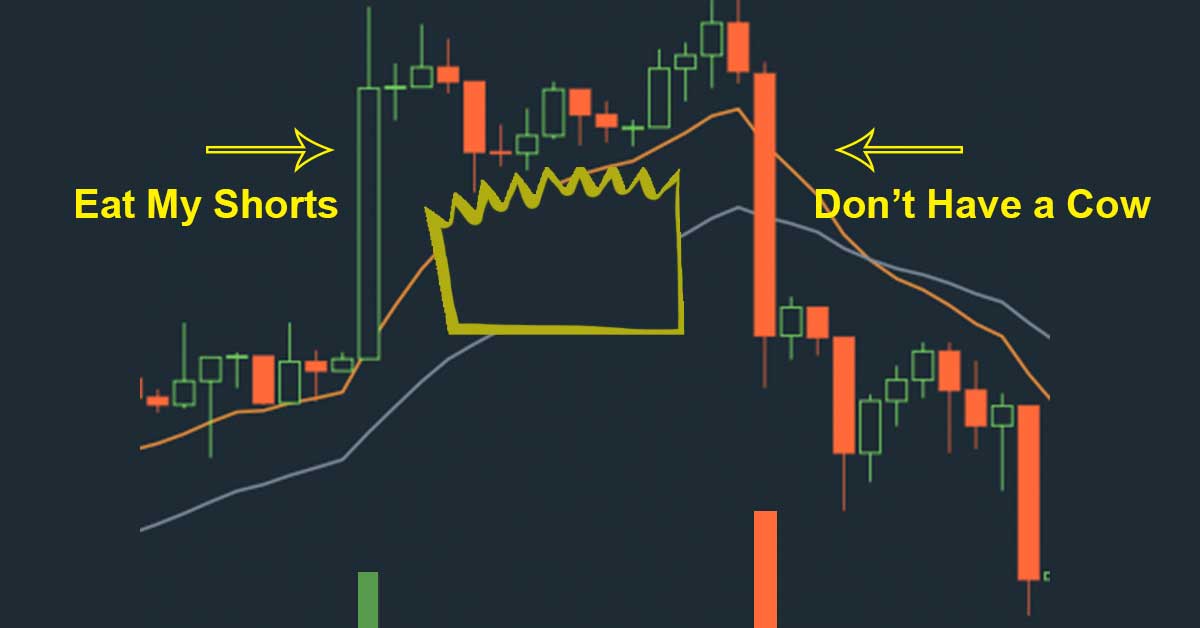
A Bart starts off with a substantial pump that forms a big green candle (the big candle to the left in the image above for example; the one with the “eat my shorts” arrow pointing to it).
This candle, generally spurred on by the market orders of big players, is formed as shorts are forced to close leveraged positions (AKA “eating shorts”), stop-buy orders are triggered, traders FOMO buy, and bots buy based on signals in quick succession.
The next part of the pattern tends to look like a bull flag as the price action begins to consolidate.
Then however, instead of the flag breaking up or down, the price action moves sideways forming what looks like little spikes (this is the part that looks like spiky hair). I call this “Bart-ish consolidation” (but its really just a form of distribution).
Then, after trading sideways for a while in a wave of distribution, the pattern ends with a Bart correction which takes the shape of a giant red candle that is about equal length to the first green candle.
This red candle is formed as other big players force the price back down, stop losses are hit, traders panic, longs close their leveraged positions, bots sell based on signals, and the “liquidity gap” formed by the first candle is filled.
The grand result of this is that it forms what looks like a recognizable head of spiky hair sitting on top of an equally recognizable head.
With that said, an inverse Bart pattern may form when this all happens upside-down (first a drop, then the spikes, then an increase equal to the first drop).
A Bart can be formed on any time frame, but 15-minute to 1-hour candles make spotting Barts and Inverse Barts easy.
Bitcoin’s chart is full of Barts on 15-minute, 30-minute, 45-minute, 1-hour charts, and sometimes even daily charts. Ay, Caramba!
TIP: For more see: BTC Did a Very Typical “Bart” (i.e. This is a Good Example of a Bart).
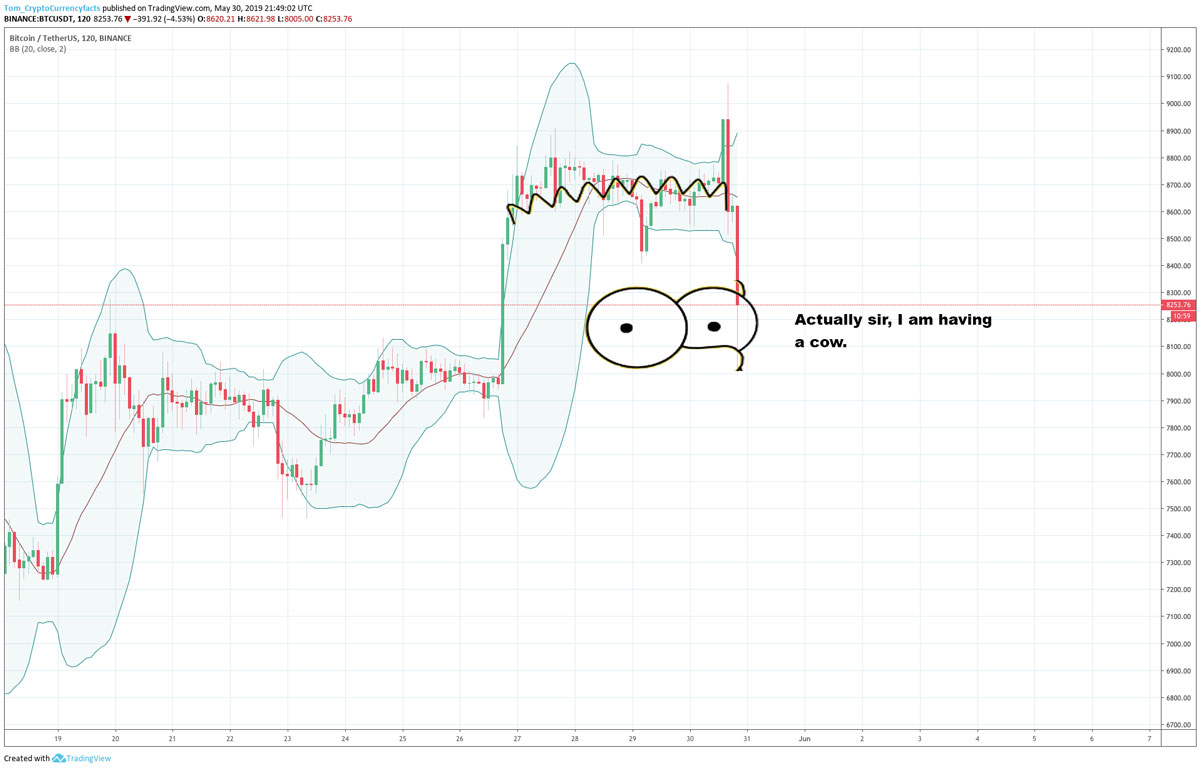
A great example of a classic Bart.
Bart Crypto Tips
Below are some tips and tricks for understanding Barts and playing Barts.
Bart Crypto Memes vs. Liquidity Gaps: In crypto, a “Bart” is a meme. However, in reality, a “Bart” is actually a common pattern in trading called a “liquidity gap.” Basically price tends to move in the path of least resistance, and a lack of liquidity (a lack of active trading in a price range) generally creates an area with low resistance. In short, a “Bart” is actually just a “common liquidity gap” being filled. Check out the video below on gaps.
Understanding Gaps: Common, Breakaway, Runaway, and Exhaustion Gap.Barts as a Continuation Pattern: I consider Barts to be continuation patterns. In an uptrend both regular and inverse Barts tend to not effect the overall direction of the trend, and thus are bullish continuation. In a downtrend, same thing, they tend to be bearish continuation patterns.
No Pattern Has to Play out All the Time: Although in general buying the spiky consolidation of an inverse Bart and selling the spikes of a Bart is a good move. No pattern has to play out a given way. The pattern could break upward after consolidating instead of breaking down for example. Actual patterns work this way, and meme-based patterns are no exception.
Barts vs. Bull Flags or Bear Flags: A Bart tends to occur when the price can’t continue the trend after the initial candle and instead “the liquidity gap gets filled.” A bull flag or bear flag is like half a Bart that is expected to resolve into a continuation of the upward or downward movement instead of a reversal. A bull or bear flag that starts like a Bart is essentially a “runaway gap” with no fill. It can be hard to tell which pattern is forming, but keep in mind the start of each pattern can look similar. Given this, it can be a good move to open a position on the exit pump / dump (a failure of continuation at the end of a Bart).
Exit Pumps / Dumps (AKA Failed Attempts to Continue the Move) Right Before the End of a Bart: Right before a Bart “Barts back down” we tend to get an exit pump (a quick pump that ends below the range that has been forming and starts to point down). Selling this exit pump (selling when it fails) is generally a good move. Then buying back below the previous range is generally a good idea, since the Bart tends to go back to the range before the initial green candle.
Bartish Expectations: Since the red candle tends to match the length of the green candle on a regular Bart (and the green the red on an inverse) it can be useful to see this formation coming into play on a number of levels. For one, it gives you a strong hint as to the size of the next major price move and the direction of this move. Keep in mind though, the second candle doesn’t always have to be the same length of the first, it just tends to be.
Barts Follow Loose Rules: One might loosely refer any pattern that sort of resembles the above as a Bart (for example a pattern in which the two candles don’t exactly match in size). Ultimately we are discussing a term that crypto traders on the internet made up, so the entire thing should be understood as a meme first and foremost and taken with a grain of salt. With that said, traditional liquidity gaps also behave this way and other common patterns like Wyckoff phases behave this way too. In fact, liquidity gaps aside, we can also generally compare some Bartish price action action to Wyckoff’s theories and to further see how there is a little more than just a clever meme going on here.
The origin of the term Bart: No one knows, or if they do they haven’t commented below to tell me, but I started hearing traders use the term in I think mid-to-early 2018. Just remember though, this is a common pattern in trading that became a meme in crypto, so the pattern far outdates the meme.
For more reading, see The “Bart” pattern in crypto. Why they form and how to spot them.
Author: Thomas DeMichele
Thomas DeMichele has been working in the cryptocurrency information space since 2015 when CryptocurrencyFacts.com was created. He has contributed to MakerDAO, Alpha Bot (the number one crypto bot on Discord),...
Thomas DeMichele's Full Bio