Satoshi and the Giant Falling Wedges
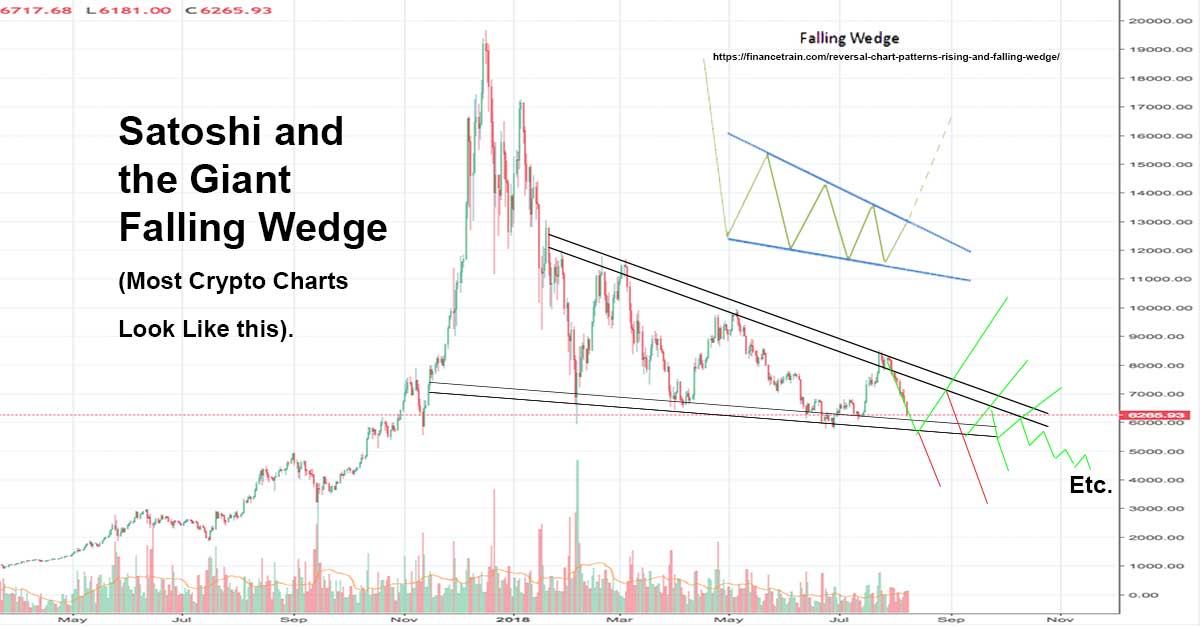
One could argue that most crypto charts, in most trading pairs, are forming giant falling wedge patterns (a bullish reversal pattern). This wouldn’t be the first time this sort of pattern has occurred in crypto and resulted in the start of a new market cycle.
UPDATE: Sept 2018, Bitcoin is still forming the same pattern. Meanwhile the rest of the market is getting ground down…. Now Nov. looked like the pattern was breaking, but actually it just reformed See image below).

Bitcoin since 2012 with some chart patterns and trend lines illustrated.
First off, there are a few notes to cover:
- Descending triangles (often bearish) and falling wedges (often bullish) are similar patterns, one could argue most cryptos are forming either of these patterns. Descending triangles are bearish continuation patterns, falling wedges are bullish reversal patterns. So that difference does matter. One could also argue a few charts are more-so forming symmetrical triangles (another similar pattern; generally a continuation pattern, which in this case would be bearish). They all take on a similar shape and are differentiated mostly by the slope of trendlines (which in the case of BTC and ETH the trendline along the lows only slopes very slightly).
- A giant falling wedge is almost formed by necessity in an economic bubble where there are many rally attempts along the way down. Crypto is full of bubbles, and full of rally attempts on the way down in most cases, and thus ends up being full of falling wedges.
- Because crypto is chalk full of falling wedges in its history, we can see near countless examples of these patterns playing out (go to Trading View and look at any coin in USD or BTC on Poloniex so you have enough data and you’ll see them; try LTC, BTC, and NEO). For coins that made it to 2018, every coin I have looked at in the top 100 coins by market cap (not every coin, but every coin I looked at, say like 40 or so) falling wedges have always eventually broken up into a rally. Essentially there is a 100% success rate, which is nuts. In fact, even if you say “no Tom, these are triangles,” it doesn’t really impact what I’m saying as I would reply, “ok, well, the triangles broke down and then eventually recovered to form more triangles.”
- All that covered, there is never much reason to be bullish in a downtrend (we are currently in an overarching downtrend in 2018 AND on the down side of the most recent “mountain type / head and shoulders type thing” we have going on here). We could easily be in for 50% losses assuming the bottom trendline of the wedge doesn’t hold and the pattern breaks down (as the pattern can break down, then we can adjust the bottom trend line, and still show the same pattern… so we could lose another 50% and still end up with a falling wedge at the end of the day for example). Meanwhile, even if it does hold, the trendline is around $5.5k, the last bottom is at $5.75k, and BTC has tended to bottom around $6k in 2018 (all those numbers are lower than the price while I write this)… Plus, BTC can take off without alts, and if crypto dies for some reason, then it could be that no coins resolve the pattern in a favorable way (historically both BTC AND ETH would need to rally for this to resolve into a run for alts). So, cool to know, but lots of room to go wrong here.

Ultimately any pattern could play out or not (its about probabilities, not certainties). The point of this page isn’t to say “buy here” or “sell here,” it is to say “dang dude, Bitcoin looks like a giant falling wedge to me, would be cool if it works out that way.”
There really isn’t much more to say, simply look at the graphic above for an illustration of what I’m talking about then go look at charts like you are playing “Where’s Satoshi’s giant falling wedges” as you scour crypto history. You’ll notice those patterns tend to result in a run eventually… but like, often after more downside.
NOTE: If what looked like a bunch of Volcanos erupting ends up being a giant falling wedge, that is good for cryptocurrency holders and buyers. If this pattern fails, it is time to reassess. When I made the image below I was showing how Bitcoin looked like a bunch of volcanos that were going to “kill your alt portfolio”… that ended up being true. Has nothing to do with seeing the future, has to do with seeing patterns emerge and understanding that it is one way things could go and have gone before. Talking about it is informative and entertaining, but everyone needs to make their own decisions about when and if to invest in the ultra risky often portfolio killing crypto.

One way to look at the Bitcoin crash of 2018.
Author: Thomas DeMichele
Thomas DeMichele has been working in the cryptocurrency information space since 2015 when CryptocurrencyFacts.com was created. He has contributed to MakerDAO, Alpha Bot (the number one crypto bot on Discord),...
Thomas DeMichele's Full Bio