How to Time the Bottom of a Market
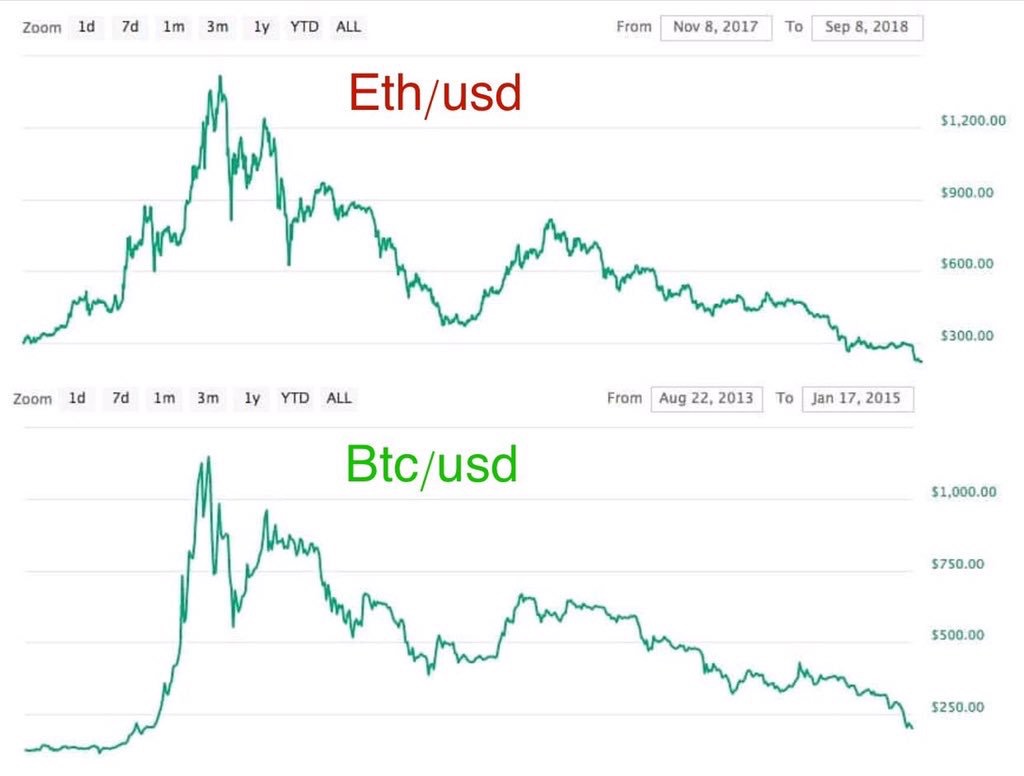
No one can time the bottom of a market, but there are some signs to look for the help you spot the bottom of a market cycle.
A section focused on technical analysis. Any article that looks at charts or talks about how to look at charts can be found here.
Please note we don’t do price targets on this site, we do educational content focused on learning about the basics of technical analysis.
With that in mind you’ll find two types of content here:
Discussions about the fundamentals of the technicals and resources. Things like “what is technical analysis,” “how to use Trading View,” and “how to use moving averages in crypto.”
Educational and informational looks at historic, current, and potential crypto charts (sometimes compared to non-crypto charts). So things like “a comparison of 2014 and 2018,” or comparing the tech bubble to the crypto bubble,” or “bulls need to ward off this death cross or it won’t be a good look technically speaking; Let’s take a look at what death crosses mean.”
NOTE: This content is meant to be informational and educational; it is not investing advice. That said, here is some free life advice, as a general rule of thumb don’t make important financial decisions based on information you find on the internet… ?

No one can time the bottom of a market, but there are some signs to look for the help you spot the bottom of a market cycle.
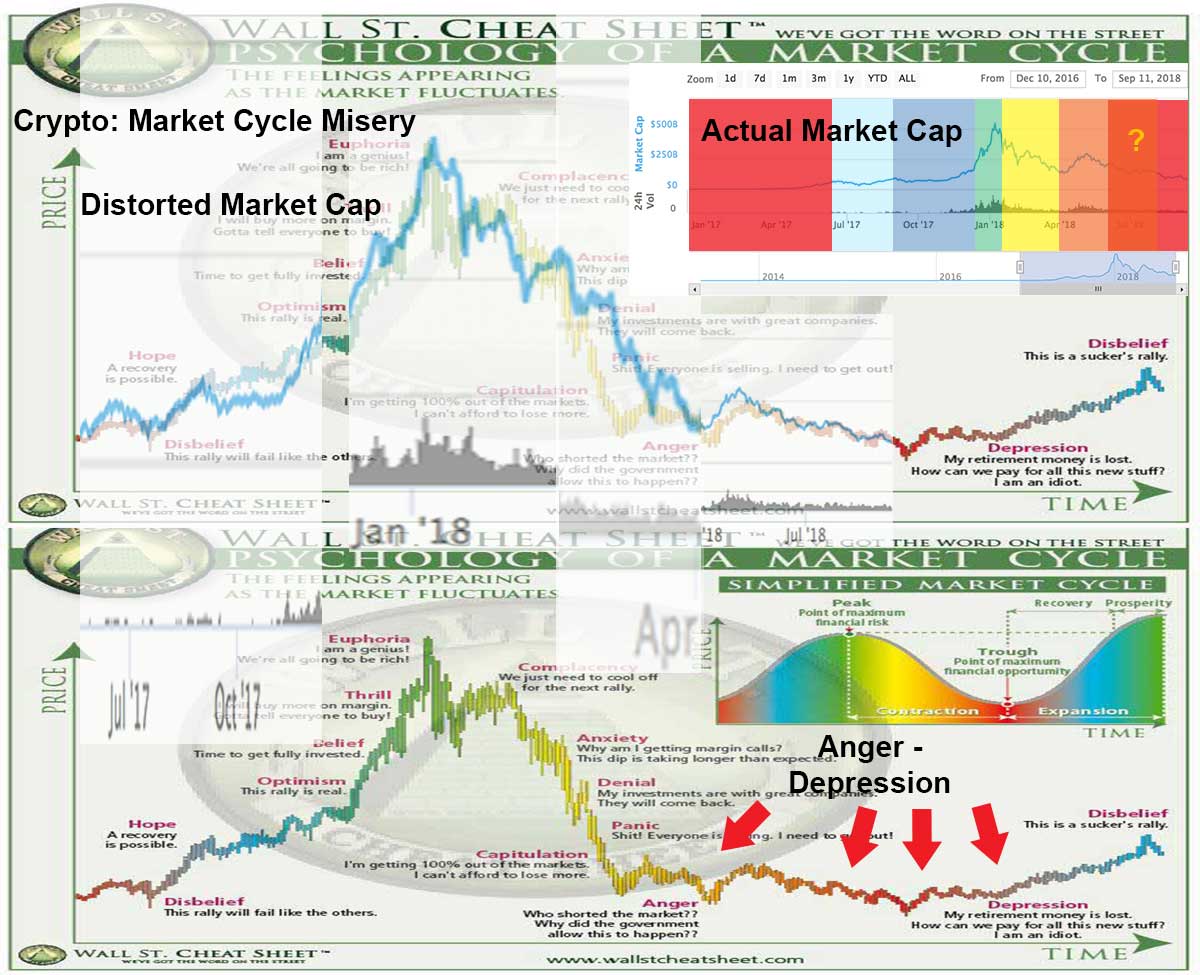
Is this the anger / depression phase of the cryptocurrency market cycle? Let’s take a look at the phases of a market cycle and the chart of the crypto market cap over time to see.
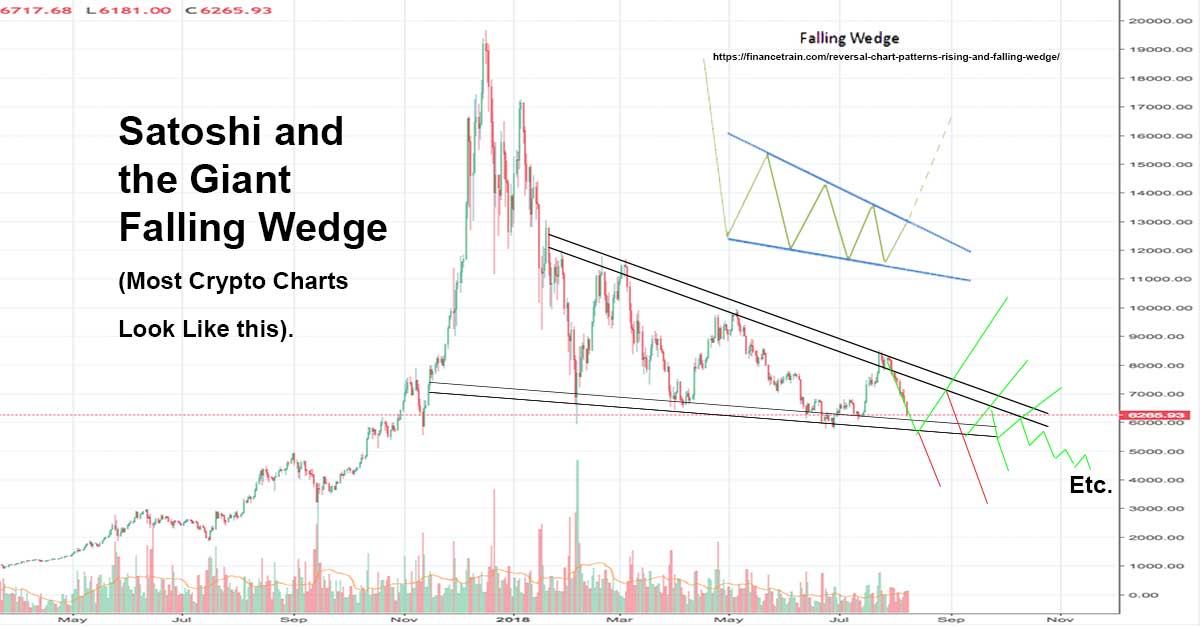
One could argue that most crypto charts, in most trading pairs, are forming giant falling wedge patterns (a bullish reversal pattern). This wouldn’t be the first time this sort of pattern has occurred in crypto and resulted in the start of a new market cycle.
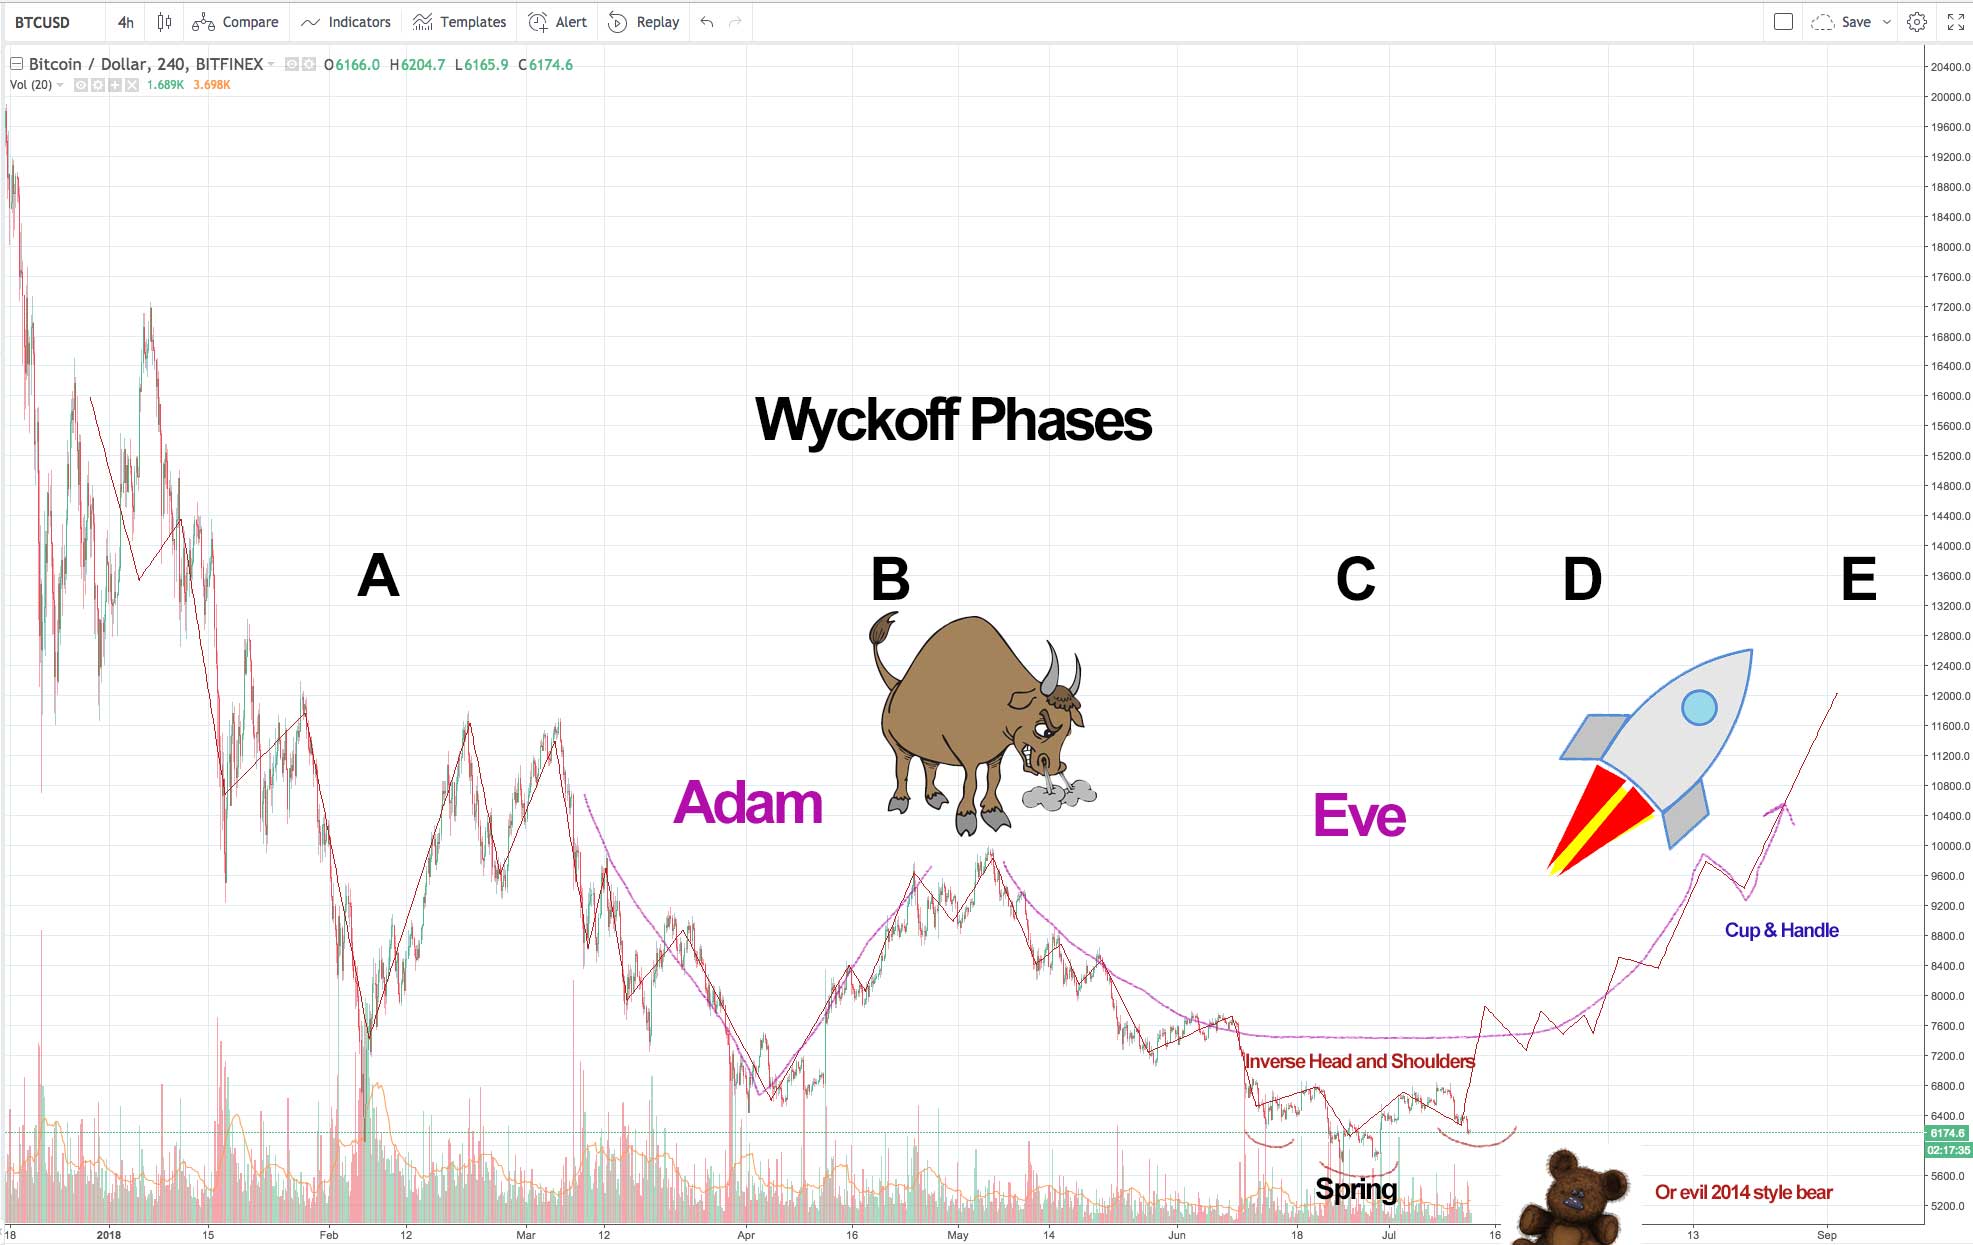
Here on July 12th, 2018 Bitcoin is in a bear market and some indicators are bearish. However, there is also a potential inverse head and shoulders and Adam and Eve forming which could take us back to a bull market. Let’s examine the bull case vs. bear case.
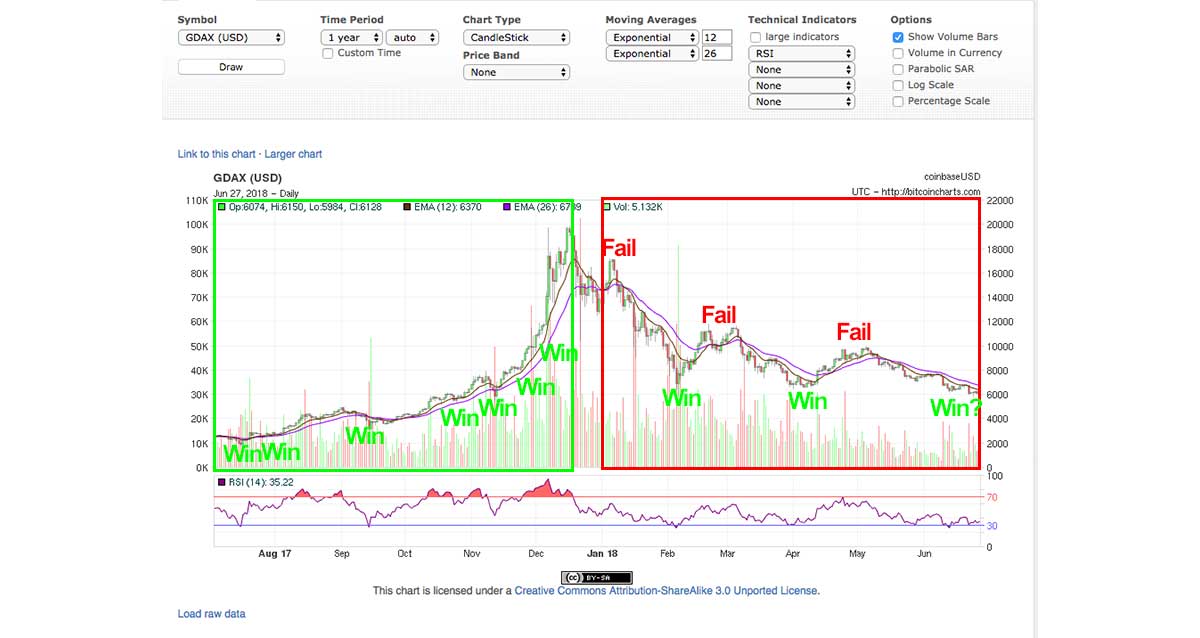
In simple terms, a bear market is when the trend of prices is down, a bull market is when the trend of prices is up.
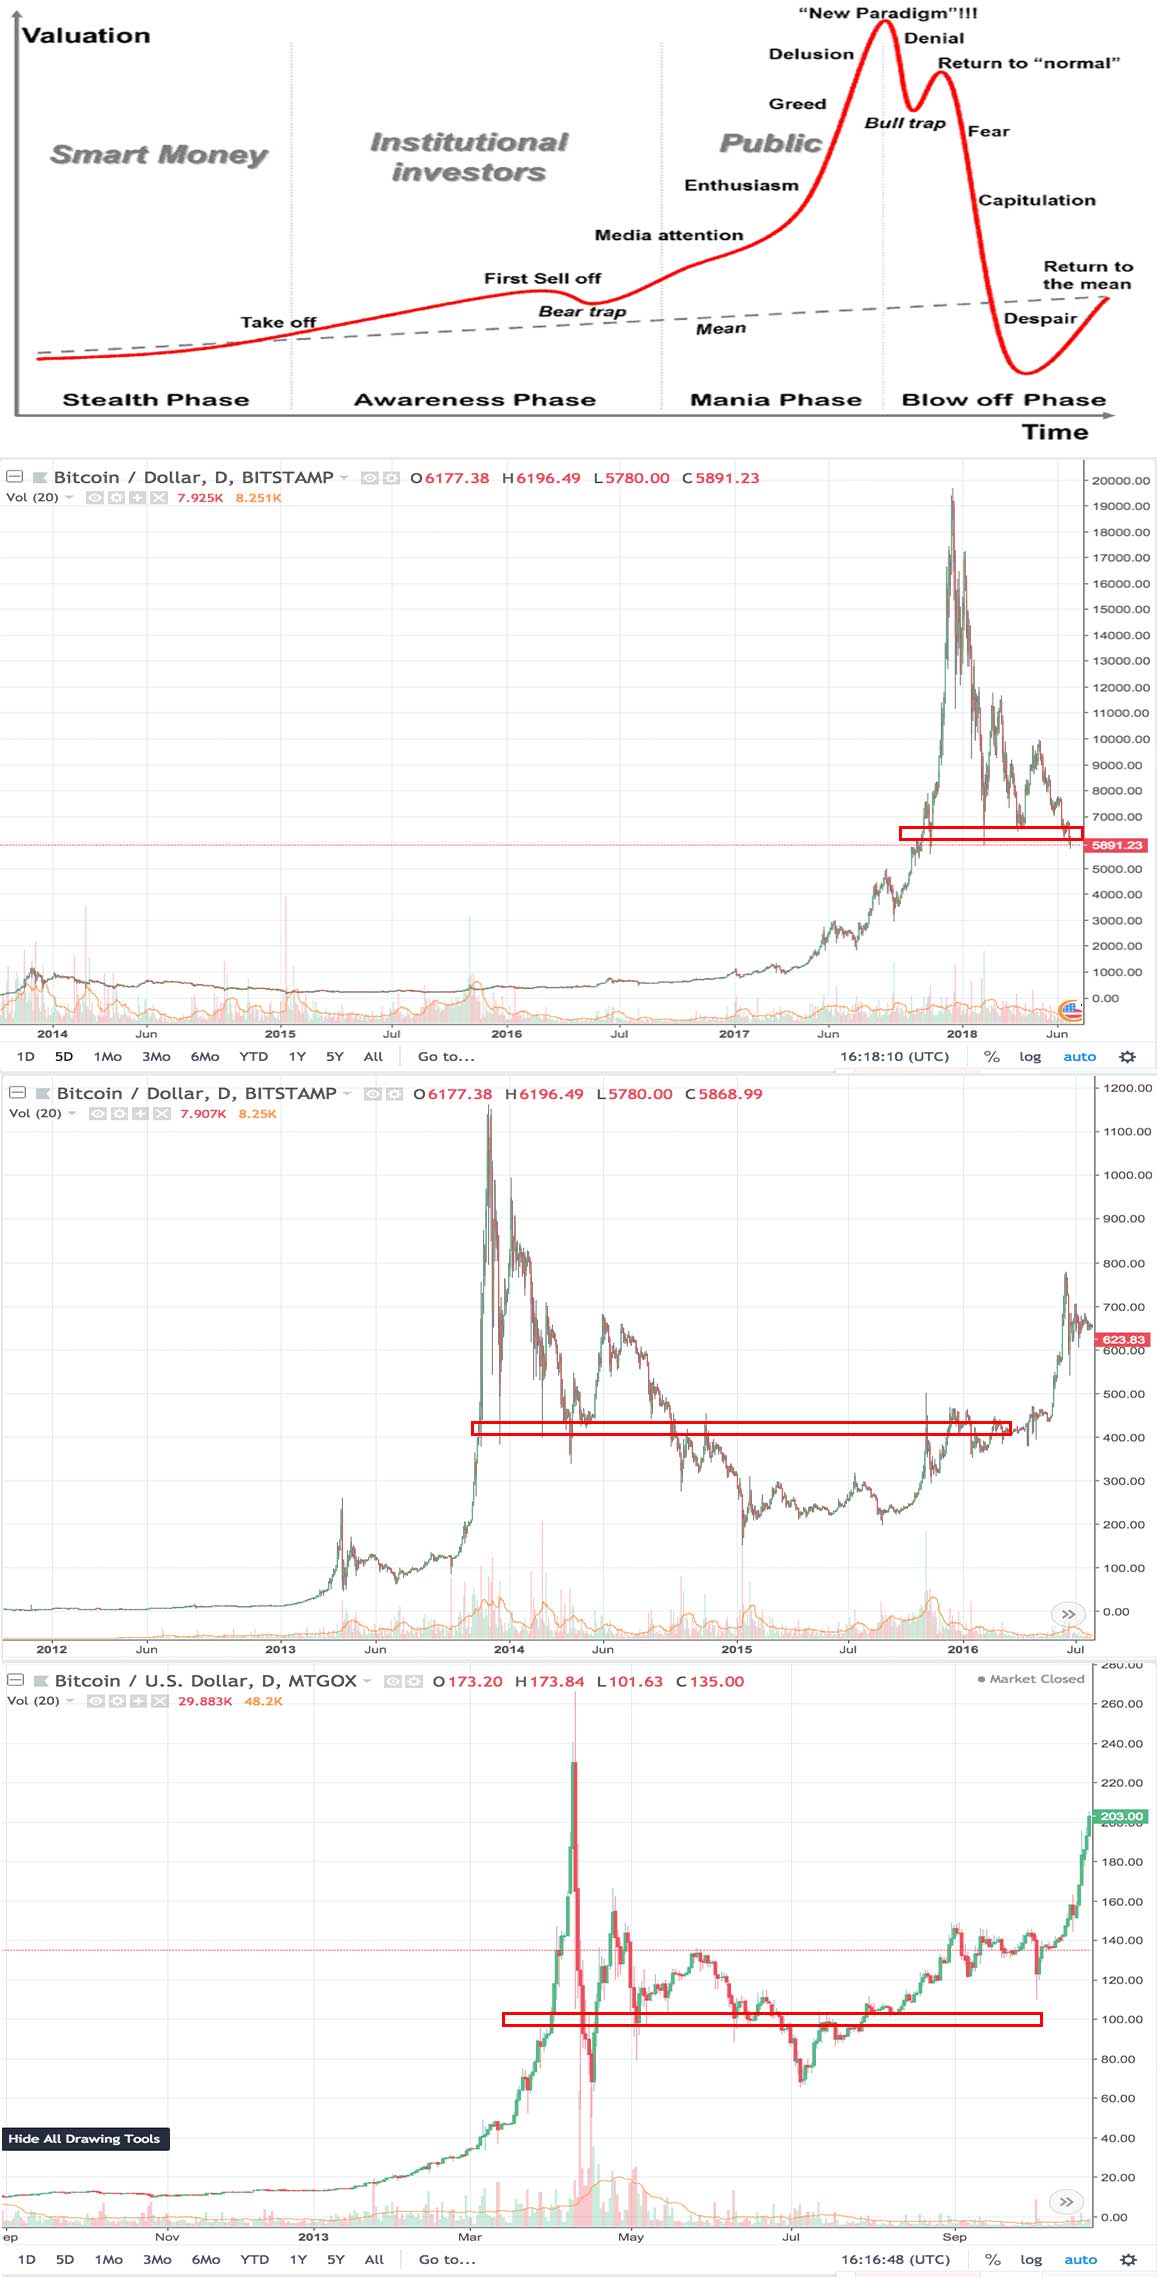
Crypto tends to move in fairly predictable cycles, this is that part of the cycle when everyone capitulates, panics, and eventually falls into despair. It is the popped side of a classic economic bubble. Luckily for crypto investors, this isn’t just “a bubble” it is a bubble in the crypto space (where bubbles are painfully common and markets are absurdly quick to form patterns).
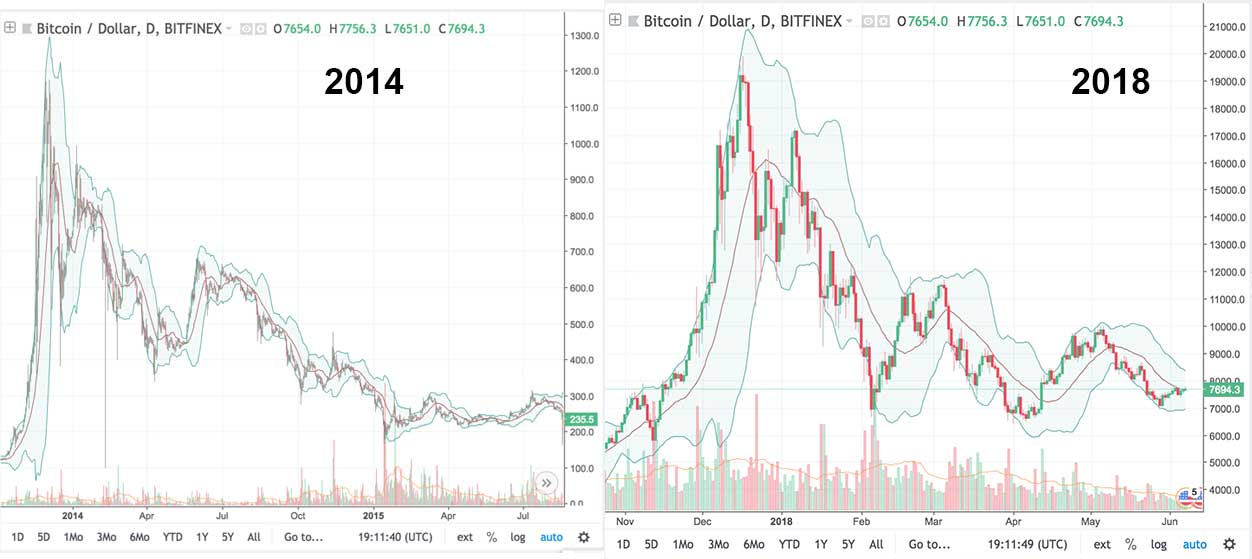
I personally think Bitcoin’s 2014 price chart is worth comparing to the current 2018 chart, as there are many similarities. Here are some thoughts on the comparison.
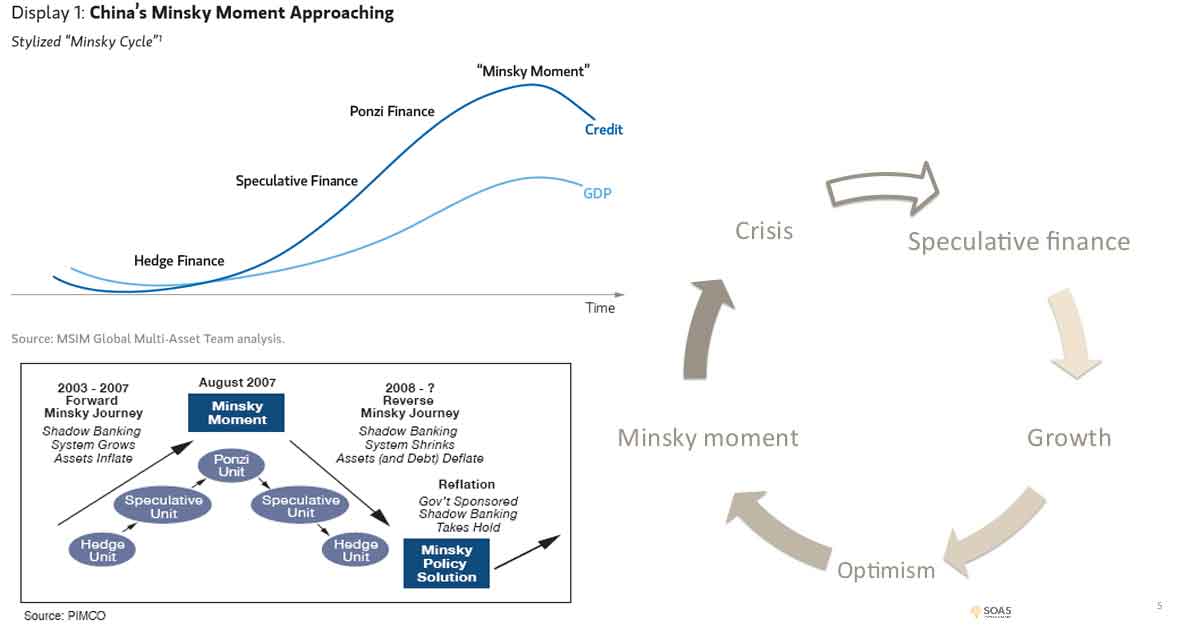
Market cycles are a natural advent in any market. However, because the cryptocurrency market moves so quickly, market cycles are especially important to understand in cryptocurrency specifically.
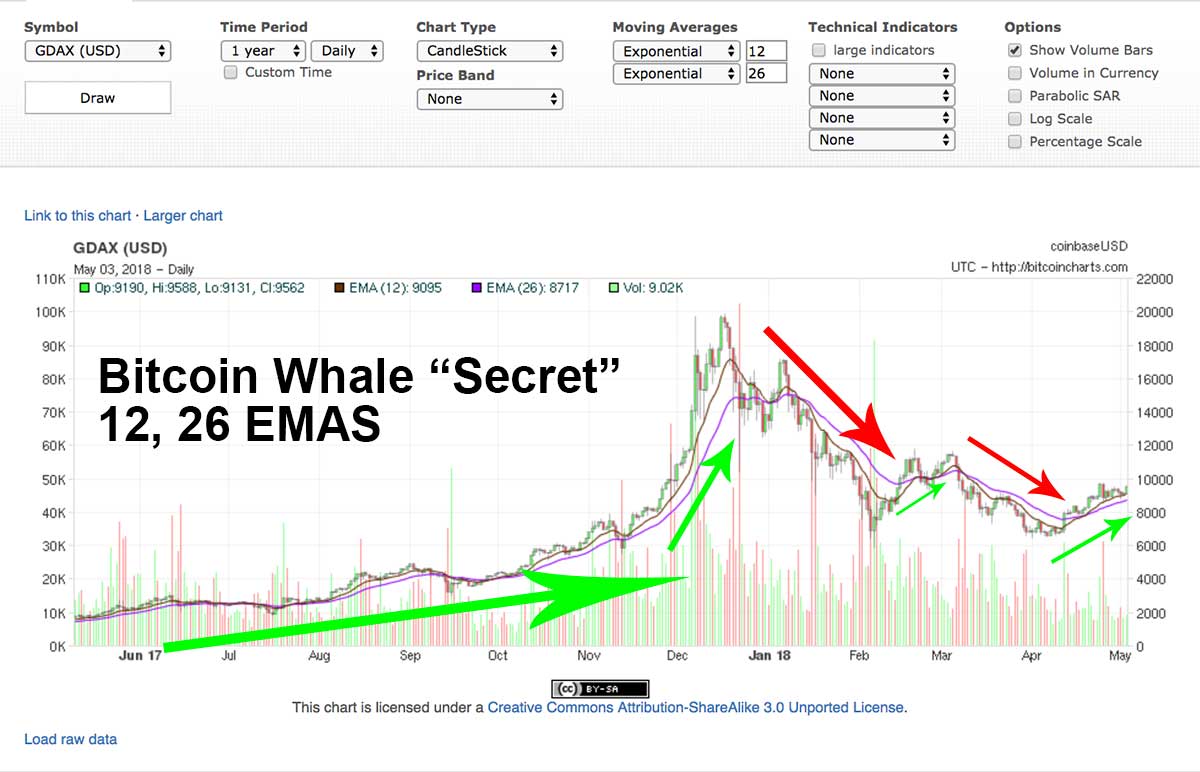
One of the simplest ways to gauge the medium term price trends of the crypto market are the 12 and 26 EMAs on Bitcoin on daily candles (the only indicators on GDAX).
If you are trading cryptocurrency or investing in it, it can be helpful to have a basic grasp of chart analysis and a few standard chart patterns and technical indicators. We present a simple to understand guide for beginners.
By continuing to use the site, you agree to the use of cookies. more information
The cookie settings on this website are set to "allow cookies" to give you the best browsing experience possible. If you continue to use this website without changing your cookie settings or you click "Accept" below then you are consenting to this.