The 12 and 26 Day Bitcoin EMAs Are a Good Gauge of Crypto Trends
If You Follow This One Indicator, You’ll Generally Be on the Right Side of the Crypto Trends
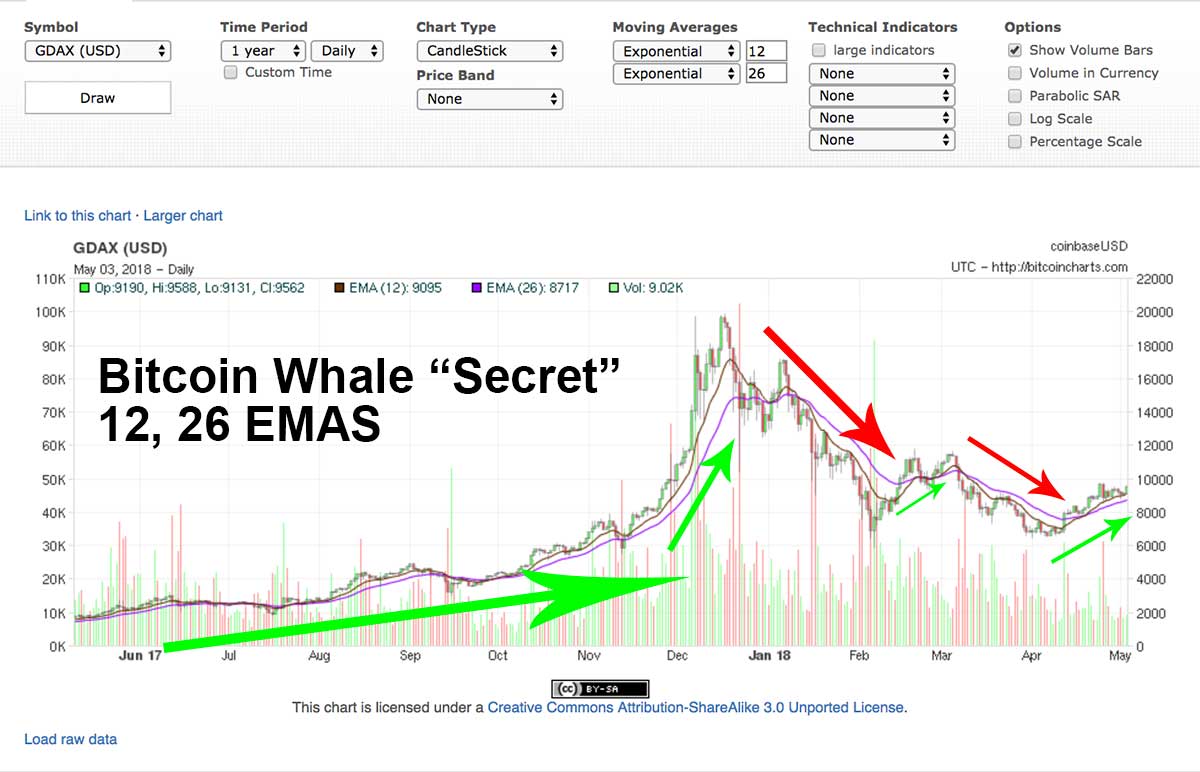
One of the simplest ways to gauge the medium term price trends of the crypto market are the 12 and 26 EMAs on Bitcoin on daily candles (the only indicators on GDAX).
If you zoom in and look at shorter time frames, this trick still works, however the more you zoom in, the more complex things get, the more it speaks to the heat of the moment, and the less it speaks to overarching trends. To keep it simple, let’s only focus on the 12 and 26 emas on daily candles (that which is featured in the chart above, where each “candle” is one day worth of price action and the lines on the charts are the 12 and 26 day exponential moving averages).
For over a year now these indicators have told you everything you need to know about medium term Bitcoin trends (trends over weeks as opposed to months or minutes or days), and by extension, about altcoin trends in this same time frame (as alts tend to react to Bitcoin).

The logic is really very simple.
NOTE: Everything below is often also true for Ether. Ether is however typically more volatile and generally will itself react to Bitcoin. It also tends to work on top alts (especially in terms of USD values). However, alts are even more volatile. Meanwhile, the further down the list you go by market cap, the less useful this tactic is.
The simplest rules for the 12 and 26 on daily candles [assume I am referring to daily candles unless I say otherwise]:
- If the price [the body of the candle specifically] is consistently sitting on top of the 12 and 26 day EMAs it is bullish and you can expect Bitcoin to go up.
- If the price is consistently sitting below the 12 and 26 day EMAs it is bearish and you can expect Bitcoin to go down.
- If it is in-between these, it is indecision time (or simply consolidation time) and a clear break in either direction should be understood as potentially signaling a continuation or reversal of a trend.
- The less time we have spent over, under, or in-between the 12 and 26, the less certain the trend is.
TIP: In an uptrend, the 12 will cross over the 26 and stay there, so it’ll be the line sitting on top. It is the opposite in a downtrend. When the short term 12 crosses over the long term 26, it is a golden cross and it is generally considered bullish. When it crosses under it is a death cross and it is generally considered bearish.
TIP: At some point an uptrend will be broken, and at some point a downtrend will be broken. So the above rules will always fail at some point necessarily.
A rule for smaller time frames:
- If you need to zoom in, as say the price went wild and you need to make choices in the short term, go to the 6hr (very useful and used on GDAX) or 4hr, then the 2hr, then the 1hr, then the 30, 15, 5, 1, etc. The further away from the daily EMAs the price action is, the more relevant the shorter time frame candles will be in the moment. If Bitcoin just went flying up or down, you’ll find the price predictably hovering over or under the 12 and 26 day EMAs on a smaller time frame like the 1min candles. Essentially the same rules apply in the smaller time frames, but they speak less to the overall trend and more to the trend in the moment.

Examples of the price tracking the EMAs on different timeframes. The trend here is bullish starting April 12th 2018 (and bearish before that). You can see the bullish trend from the price generally staying above the 12 and 26 on the higher time frames after that date and below those before it. Notice how the bulls saved Bitcoin as the 12 and 26 tightened on the 6hr chart on the far right where our chart ends?
TIP: In the image above, as it says in the caption, roughly speaking everything that is happened from April 12th on is bullish, and everything that happened from before that date is bearish from a zoomed out frame. Dipping under the averages in an uptrend or reaching over for a second in what is otherwise a downtrend doesn’t carry a lot of weight unless it jump starts a new trend. From this zoomed out perspective focused on these emas, a longer term investor will find they need to make very few moves in crypto (assuming they are willing to leave a little profit on the table by missing ideal entries and exits).
Other useful rules for the 12 and 26 on daily candles:
- If the price is sitting between the 12 and 26 in what is otherwise an uptrend, a clear break up above the 12 is bullish and below the 26 is bearish. This can for example happen in a correction.
- If the price is sitting between the 12 and 26 in what is otherwise a downtrend, a clear break up above the 26 is bullish and below the 12 is bearish. This can for example happen in an attempt at a rally.
- If the price is constantly trading under the 12 and 26 (with dailies closing under) after an uptrend, you might want to start averaging out of crypto.
- If the price is constantly above the 12 and 26, you can generally get away with HODLing.
- If the price is sitting on top of the EMAs, a steep uptrend signals us approaching the top of a overall or local bubble (you can argue that crypto doesn’t bubble; I would not make this argument). Conversely, a steep downtrend could signal the end of the uptrend (the price will likely at least test the EMAs).
- If the price is sitting below the EMAs, a steep uptrend likely signals a recovery attempt (it’ll likely try to test the EMAs). Meanwhile, a steep downtrend is likely to signal the end of the correction / crash (unless it is somehow the end of crypto; in the end days it’ll do this and then stagnate… this is what the end of 2014 was like and this is what the end was like for alts that have gone to the graveyard).
- What is true for Bitcoin tends to be true for alts in most cases (but not in all cases, for example Oct – Nov 2017 saw only Bitcoin do well; Meanwhile, during the downtrend of late 2017 – early 2018 for Bitcoin, only alts did well). Given this, you can generally get a sense of what alts will do given what Bitcoin is doing. The same tends to be true for Ether as well.
To augment those rules:
- Sitting on top of the 12 day EMA in an uptrend for an extended period of time is very bullish. It shows the bulls are in control and that the bears are unable to push Bitcoin down much.
- If Bitcoin is on a rip, alts might take a back seat (stagnating in USD and losing value in BTC).
- If alts are on a rip and Bitcoin is stagnating, and Bitcoin is at a possible low, it is likely the next trend will be up (likely a substantial rally since everything just went down so much).
- If alts are on a rip and Bitcoin is stagnating, and Bitcoin is at or just was at a possible high, it is likely the next trend will be down (likely a major correction since everything just went up so much).
- In the short term any coin can randomly gain or lose 10%, if it loses, watch to see how it bounces off the 12 and 26, if it gains, expect it to pullback if it gets too far away from the 12.
- In an uptrend you can ladder buy orders just before the 12 and all the way down to just below the 26 (this works well on 6hr candles) and then you can sell when the 15 minute RSI (or sometimes 1hr or higher) hits overbought for quick profits. Be aware however, if you do something like this you will likely miss the big runs and if it breaks and closes below the 26 you are going to have to eat losses or start HODLing for the future.
- Cryptos tend to make all their gains in big pumps and lose all their value in Bit dumps. If you play a long game using these tactics this you are very likely to have to sit through rather intense price fluctuations ($1k+ for Bitcoin, the equivalent of double that or more for top alts).
- As noted above, these tactics tend not to work as well for minor alts most of the time (unless they are in a very clear uptrend or downtrend). Lesser alts and ICOs will only pump once in a while and are generally quick to dump. When no name alts pump, it is a sign that we are about to go into correction mode in the overall market (as people tend to focus on the major coins under normal conditions).
In other words, watching only the 12 and 26 day emas on daily candles on Bitcoin (and to some extent Ether), we can know most of what their is to know about the crypto market in terms of medium term trends. From there we can extrapolate short and long term trends and make useful predictions.
On top of that, knowing about the historic crypto trends and relationships between Bitcoin and alts, we can build on that knowledge-base to make pretty useful predictions.
That means we can get a little complex, or we can keep it super simple.
The super simple is, be in crypto when Bitcoin is above the 12, 26 and out when it is under. You can do that by buying crosses, waiting for confirmation of trends after crosses occur, or buying and selling convergences and divergences.
TIP: There are a handful of other important moving averages to consider, and some work very similar to these (try charting a set of GUPPY moving averages or throwing up the 50, 100, 200, etc on different time frames at tradingview). Although they can all tell a part of the story, many of the longer term averages and shorter term averages tend to act as temporary resistance and support levels. This is different than the 12 and 26 which tell a constant and never-ending story (or at least that has been the case so far). Sure, you could use 11 and 27s, or 10s and 24s and see the same general thing… but the 12 and 26 are common and work well enough on their own. No need to over complicate things.
NOTE: Also vital are fibonacci retracement levels (which need to be re-calculated as charts evolve) and RSI. If RSI is overbought on all timeframes, we are likely on borrowed time (but do consider, Bitcoin spent a good chunk of 2107 on borrowed time). If RSI is oversold, we are almost certainly going to see a recovery attempt soon (“soon” can be weeks out in the worst of times). Using RSI alone is not even remotely profitable, however, using it with other tactics (such as the ones above) is very useful.
NOTE: One might think that everyone doing this would somehow burn out this strategy, but I’m not concerned. First off, these are the only indicators on GDAX and everyone and their mother can already see this in real time (perhaps that helps explain why it is this way). Second off, I can see my site analytics and I know for a fact most people won’t read this page (the popular pages are things like “upcoming forks” not “Tom’s opinions on EMA-based strategies”). So feel free to use these ideas and roll with them if they help you. If you build an automated strategy based on your own version of this, consider slight variations like using 12.3 EMAs on 23 hour candles (so you are harder to spot; if you try to trade on the 12 and 26 on smaller time frames using automation you very likely won’t be profitable and will be easy to take advantage of).
Author: Thomas DeMichele
Thomas DeMichele has been working in the cryptocurrency information space since 2015 when CryptocurrencyFacts.com was created. He has contributed to MakerDAO, Alpha Bot (the number one crypto bot on Discord),...
Thomas DeMichele's Full Bio