Is This the Anger / Depression Phase of the Crypto Market Cycle?
Anger, Depression, Fear, Despair, and a Distant Ray of Hope
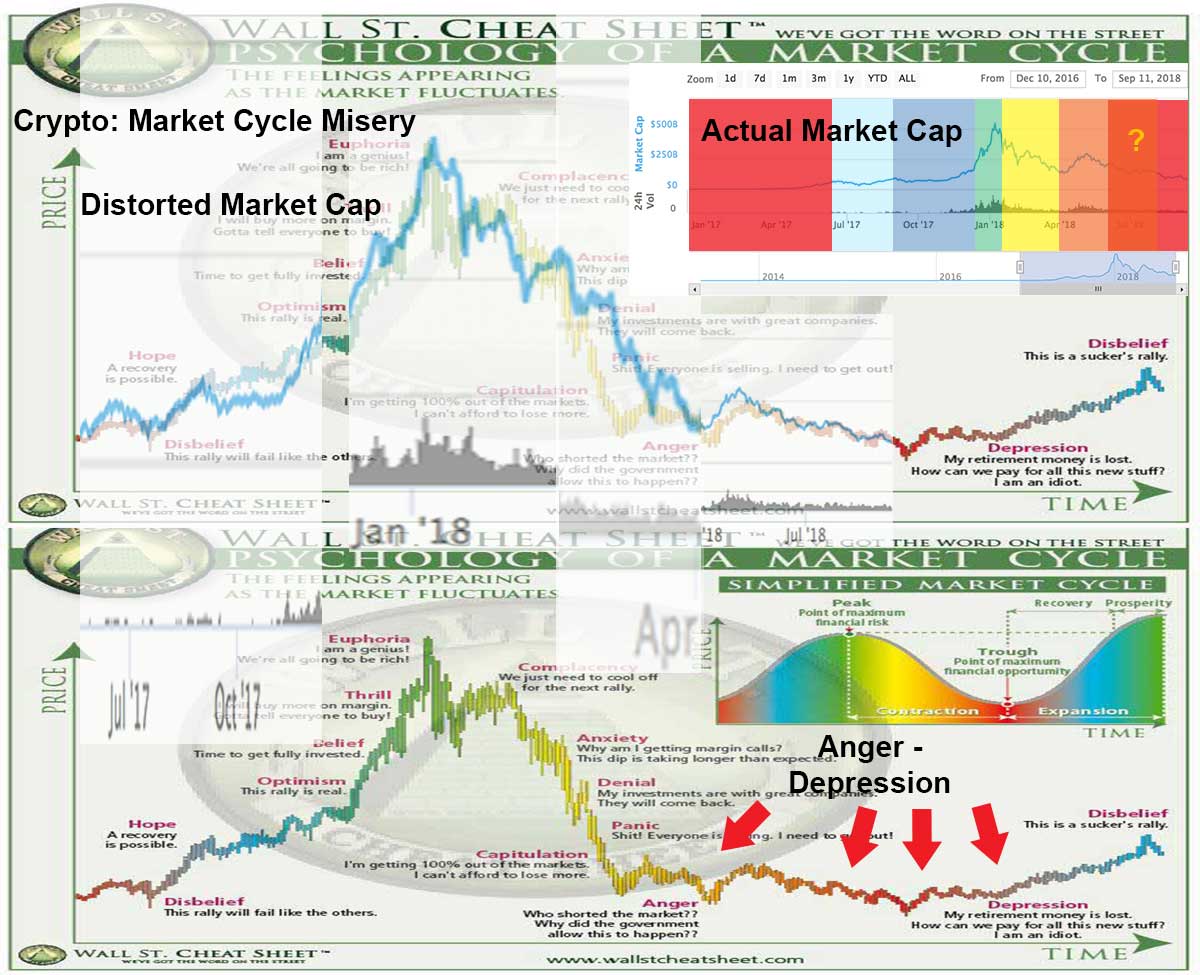
Is this the anger / depression phase of the cryptocurrency market cycle? Let’s take a look at the phases of a market cycle and the chart of the crypto market cap over time to see.
TIP: The chart above looks at the entire market cap of crypto, the chart below looks at Bitcoin only. There is potential that the entire market cap is actually further along in the cycle than Bitcoin alone.
IMPORTANT: Below is a theory meant for informational purposes. It is far from the realm of investing advice and all the way over on the philosophy spectrum somewhere past education. Importantly, the question “is this the anger / depression phase” could be answered, “no, this is still complacency, anxiety, denial, etc.” For example, what if this “near worst case log chart” below is where we are at as of Dec 2018? Point being, this page is philosophical… not investment advice.

A near worst case log Bitcoin chart compared to the wall st. cheat sheet chart.
What is a Market Cycle?

Very generally speaking a market cycle describes the periods between ups and downs in markets.
So, for an overarching market cycle, we might be looking between 1995 and 2002 in the stock market. Or from 2013 to 2015 in the crypto market. Or, to measure from peak to peak, maybe from 2000 to 2008 in stocks or 2013 to 2018 in crypto.
For this page we are looking at the 2015 – 2018+ market cycle as symbolized by the market cap of all cryptos from 2017 – 2018 (as illustrated in the chart above; see a clean and current chart).
Check out our page on market cycles in cryptocurrency if you want a more in depth refresher on market cycles.
Phases of a Market Cycle
Very roughly the phases of a market cycle might be describe liked this (these are not official terms… don’t think there are a “official” terms; this is just from the internet theory shared in the image above):
- Smart money, institutional investors, early adopters, etc accumulate Bitcoin low (they accumulate during a lower period that looks like anger and depression to those who held from the last peak).
- Bitcoin goes up (it is wise to HODL through disbelief and hope).
- People get excited and the price goes up even quicker as many FOMO buy (those who bought lower start to distribute some as they mark up the price; it is wise to HODL and/or SELL through belief, thrill, and finally euphoria).
- Bitcoin is distributed high (this phase consists of the price action near the top all the way until complacency; SELL).
- Bitcoin goes down (anxiety and denial; SELL if you haven’t, SHORT and play BOUNCES).
- People get sad and panic (anxiety to panic; SHORT).
- Bitcoin goes down even quicker as people panic sell (PANIC!… play BOUNCES).
- Bitcoin bottoms out in a messy pattern that can see a gradual grind down of the rest of the market (anger and depression; this is the accumulation phase; range trade and accumulate).
- Repeat.
Or in simpler terms: accumulation, greed, distribution, fear, repeat.
TIP: In very simple terms, as a general rule of thumb be long in the green, and short or sell bounces in the red…. although clearly you want to start your long position during anger / depression if you can and start your short position during the euphoric top if you can. See the bear market vs. bull market chart below for a different way to look at this using Bitcoin as an example.
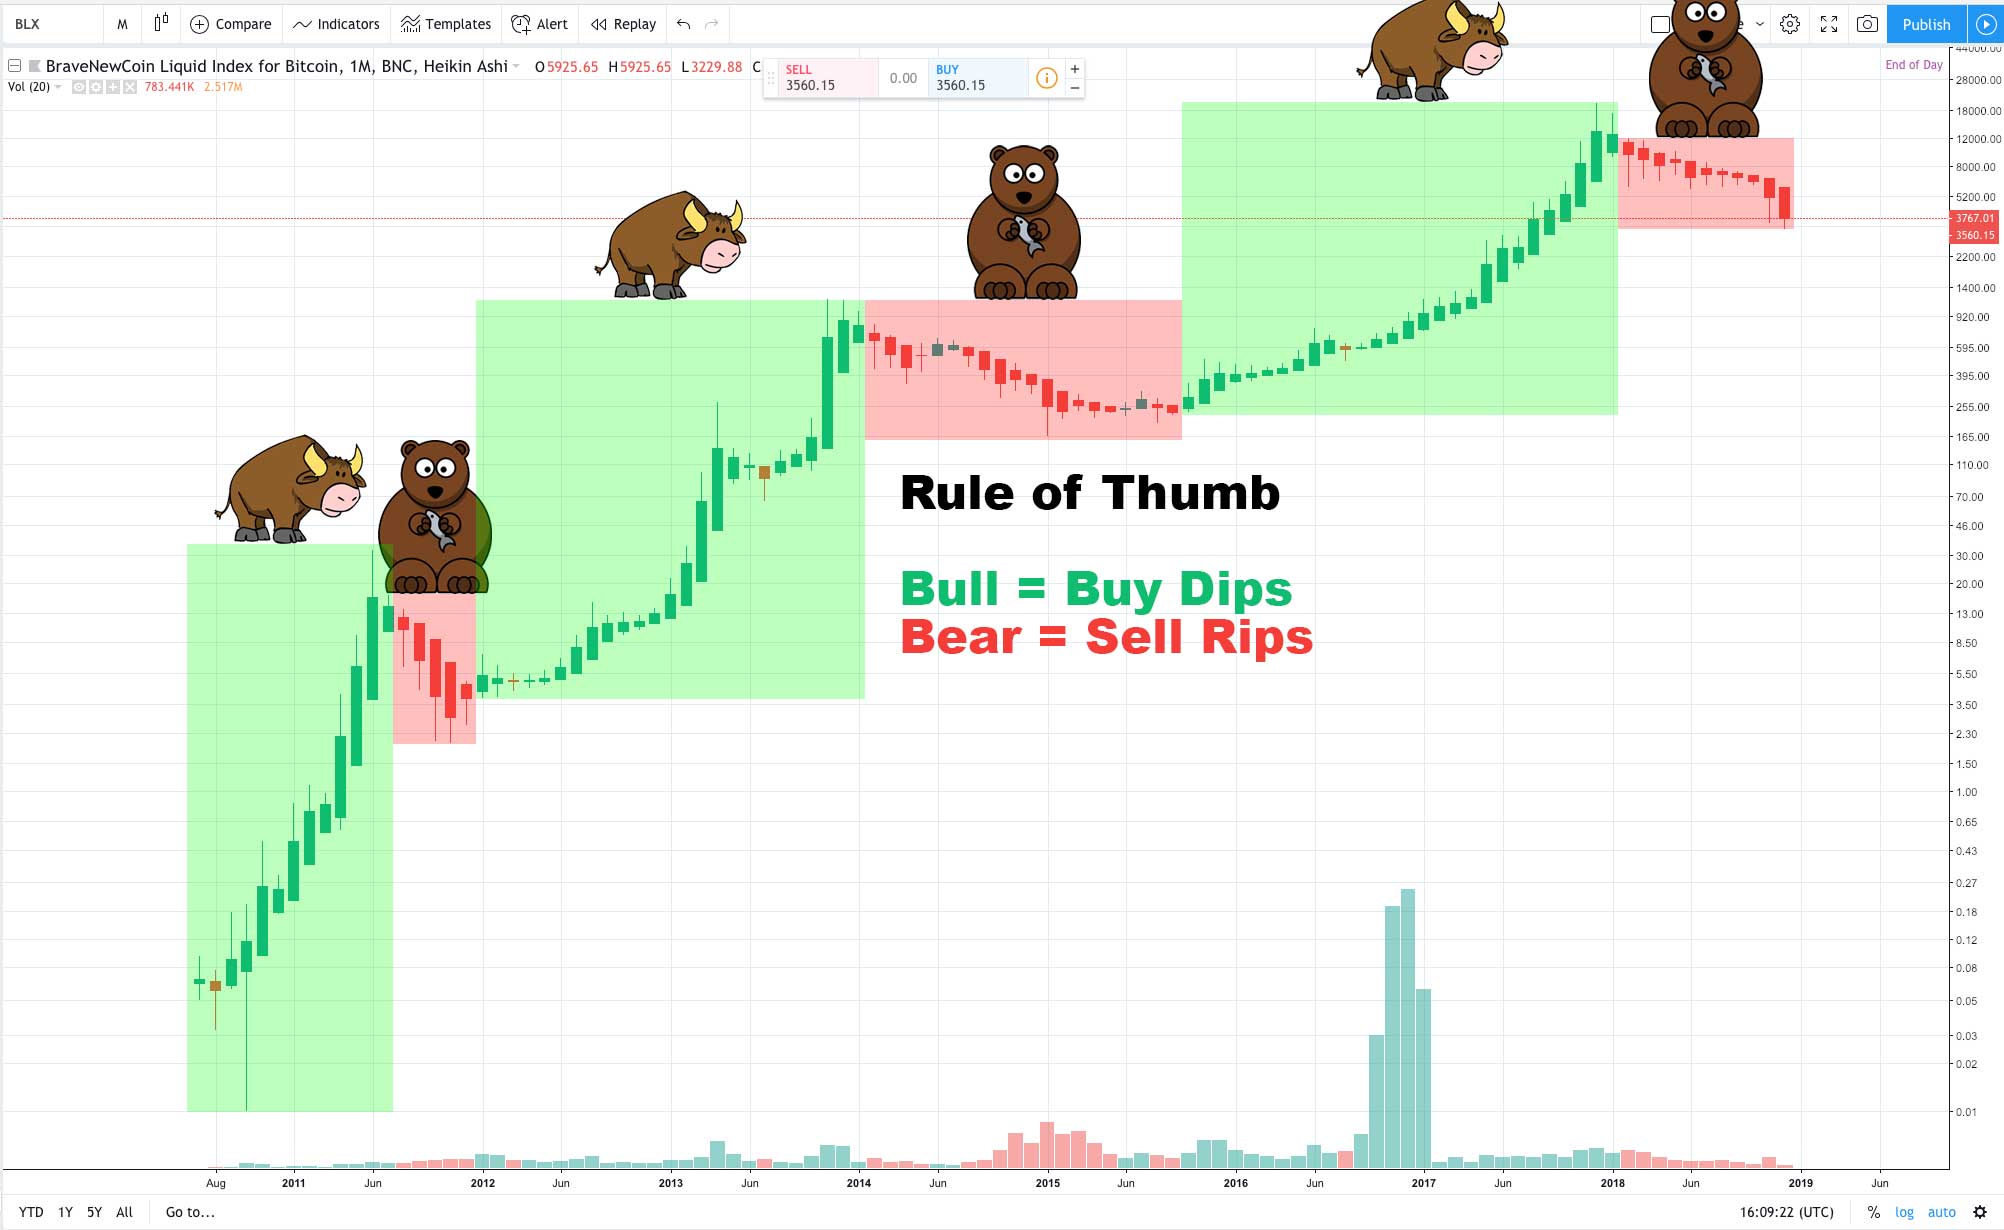
Bitcoin, bull vs. bear. 2011 – 2018.
Where are We Now?
If we accept the stages named above, then I would say:
I would argue that we [as of sept 11th] are in a fear stage, either in anger or depression, when it comes to the entire market cap (although I would leave room to be wrong, in retrospect we may find that we are earlier or later in the cycle than that). UPDATE DEC. 2018: See the chart below, that is the market cap all the way until late Nov 2018. You can see that the theory above has not yet been invalidated (although only time will tell).

Market cap 2014 to 2018.
Here are some arguments pertaining to theabove theory:
- The cap is down near where it started in 2017 (that fits the pattern of a popped bubble, where you retest or even dip below roughly where you started).
- January to February and January to April I think legitimately count as capitulation. The first phase of capitulation was a hard spike denoted by BTC dropping from $20k to sub $6k, the longer capitulation was the slow grind down from Jan to April.
- We are in a period of being slowly ground down with many failed rally attempts (which is great for accumulation and indicative of the popped side of a bubble).
- Lots of investors are down 90%+ from the top…. if you aren’t angry and/or depressed as a holder, then you probably aren’t in the norm. You have at this point “lost your retirement money” if you put it in crypto at the top.
- Every rally attempt recently has been met with disbelief. Some people are still bulls, but more and more laugh of rallies (traders short them, and the average Joe won’t buy in)
- Shorts are at 2018 highs for most top cryptos.
We are in a space where investors are getting pummeled, everyone on the sidelines is saying “I told you so,” shorts are profiting on more days than not, and natural responses to such things after already being down 90%+ are the emotions anger, depression, fear, and despair.
Yet, despite the bears being in control, we aren’t seeing grand drops like we saw from the top for the most part. We are on most days just seeing boring slow grind down with little drops here and there.
If we look at the example chart, we can see that the boring slow grind down with failed rally attempts is, in terms of the chart, the stages of “anger” and “fear.”
What To Expect Next
What you should expect next is more downside (it is generally conservative to expect the worst).
If this is anger, there is likely another sharp drop to come and more downside in general.
If this is anywhere that isn’t the end of depression, the market cap could get ground down further while Bitcoin does its thing.
If this is anywhere before anger, then a wave of capitulation could come before the true sideways grind even starts.
Also, while the market cap chart looks like it is somewhere in anger or depression, the main coins Bitcoin and Ether don’t look as far along in their cycles.
One could argue BTC and ETH haven’t reached capitulation yet (although one could also argue, yes they have, they just aren’t going to drop as much as the whole cap… there is no rule that says they have to).
In simple terms, potential futures aside, in the here and now the trend is your friend and the trend is bearish.
All that said, historically speaking anger and depression tend to be good periods to accumulate in.
What you do with that information is your call (do you play the contrarian and try to catch a falling knife, or do you stand on the sidelines and wait for clarity, or do you short the weakness, etc), in the words of the chart below, you can simply wait until the recovery from the bear trap after the first sell off to buy again and fully ignore crypto. You don’t have to try to play time the end of the bear market in anticipation of some future cycle… you can just wait on the sidelines.
IMPORTANT: A bottoming process can take a long time. 2015 was a bottoming process for crypto. It took a full year for Bitcoin to bottom out and many alts lost value against Bitcoin in that time. Visually it may look like the worst is over, and the market cap may reflect that, but any individual coin could stand to be ground down for months and months on end. In other words, don’t be deceived by the chart, there is always real risk in crypto.
TIP: Look at the 2014 chart, 2018 chart, and another example of what a market cycle in a bubble and bust economy looks like (in this one we would be in despair according to the above theory… but remember, anything can happen, maybe this is all denial and the bottom is zero, we will only know the reality in retrospect):

Comparing Bitcoin bubbles. Stages of bubble image from https://transportgeography.org
Author: Thomas DeMichele
Thomas DeMichele has been working in the cryptocurrency information space since 2015 when CryptocurrencyFacts.com was created. He has contributed to MakerDAO, Alpha Bot (the number one crypto bot on Discord),...
Thomas DeMichele's Full Bio