Will 2017 Resistance Hold as Support?
Many alts are falling toward their resistance levels from the second half of 2017. If those levels don’t hold, it could take altcoins down to uncomfortable lows.
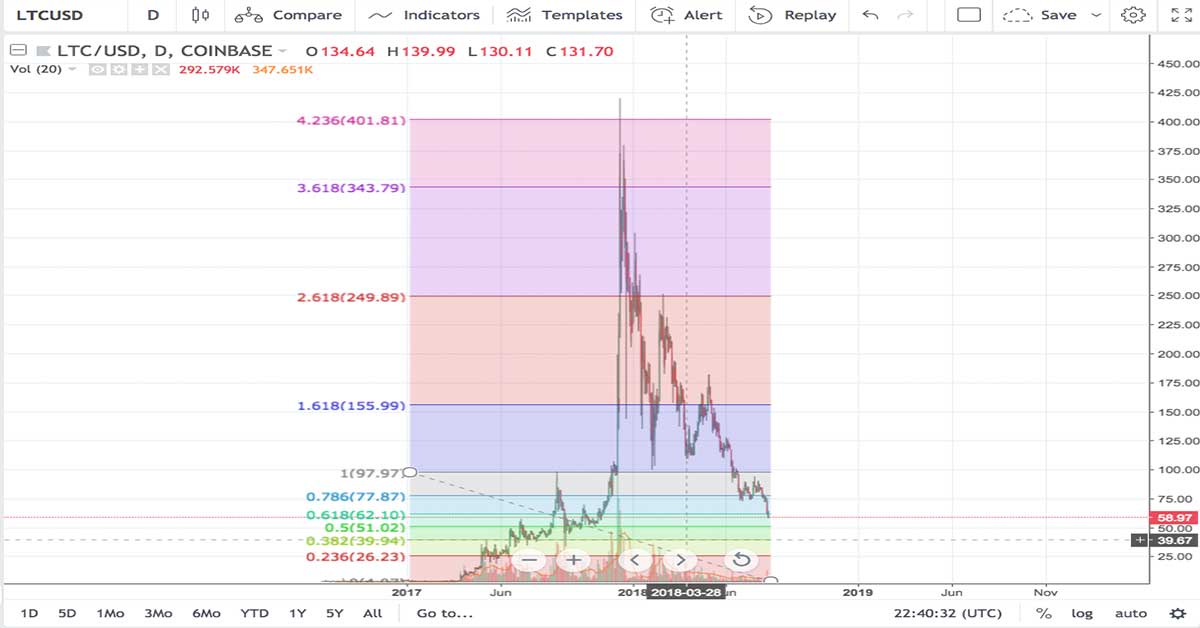
Litecoin offers a good example of what I mean, as it has been around for a while (and thus we can see in its history where it went through the 2013 – 2015 bubble alongside Bitcoin) and because it is now hitting the top of what used to be resistance in 2017 and is now acting as support here in 2018.
In simple terms, support/resistance can be defined as “places where an asset spent a while trading at.” From a more complex frame, one can use indicators like Fibonacci Retracements (what the colored boxes above are showing).

In both cases, you can sort of spot price ranges in which you can see an asset was trading in for a while in the past, to find price ranges that might act as resistance or support.
In these terms there is strong support between roughly $40 – $60 for Litecoin. Back in late 2017 Litecoin spend a lot of time trading in these levels, $60 had acted as “resistance” and $40 as support. Then, as we went up, it actually formed a pattern which we might expect to retrace all the way to the $40 – $60 zone (as it seems to be doing now).
What we would hope is that all this time later, with Litecoin being down nearly 90% from the top, that this $40 – $60 level would now act as strong support (as buyers we of course want it toward the lower range, and has holders toward the higher range, but anyone who would invest in Litecoin wants some support to hold… or eventually there will be no investment).
For that support to hold however, Litecoin will either need to go up against Bitcoin or Bitcoin will need to hold somewhere between here and $5k. After-all, as long as Litecoin tracks Bitcoin, its own chart isn’t going to do it much good if Bitcoin can hold its own!
The problem with all of this is that Bitcoin has been doing a number on altcoins recently and they have been losing value while Bitcoin almost stagnates over time (they go up with Bitcoin, but then lose more than Bitcoin when they go down, which has a corrosive effect on alts).
Still, as gloomy as it looks, if coins can roughly hold their 2017 ranges, there will be a chance of forming a reasonable bottom around that zone. To form a 2018 bottom where in pre-crypto mania we found resistance 2017, would all things considered be a pretty reasonable place to start the next cycle and could eventually lead to higher highs (imagine everything above ends up being a fractal that this time starts in the $40 – $60 zone instead of at $10; that is all that is needed to see higher prices over time).
Not every coin is in this position, but many key alts are and Bitcoin essentially is as well. Point being, a lot of coins are sitting on top of resistances from 2017 and so the hope would be that this results in a bottom being found across the board.
NOTE: If Bitcoin can find a bottom between here and $5k, it could form a falling wedge pattern which could lead to a reversal for the whole crypto market. One thing is for sure, every leg down we have to go means less and less options for turnarounds in the near future and a greater chance of a long bear market. For now we should expect more downside (because it has been the trend, and one should expect trends to continue).

Is Bitcoin a giant falling wedge? Find out at some point in the future.
Author: Thomas DeMichele
Thomas DeMichele has been working in the cryptocurrency information space since 2015 when CryptocurrencyFacts.com was created. He has contributed to MakerDAO, Alpha Bot (the number one crypto bot on Discord),...
Thomas DeMichele's Full Bio