What if Ethereum is a Bullish Fractal?

Looking at the Ether 2015 – 2018 and Bitcoin 2010 – 2018 Log Charts and Spotting Ether and Bitcoin Fractals
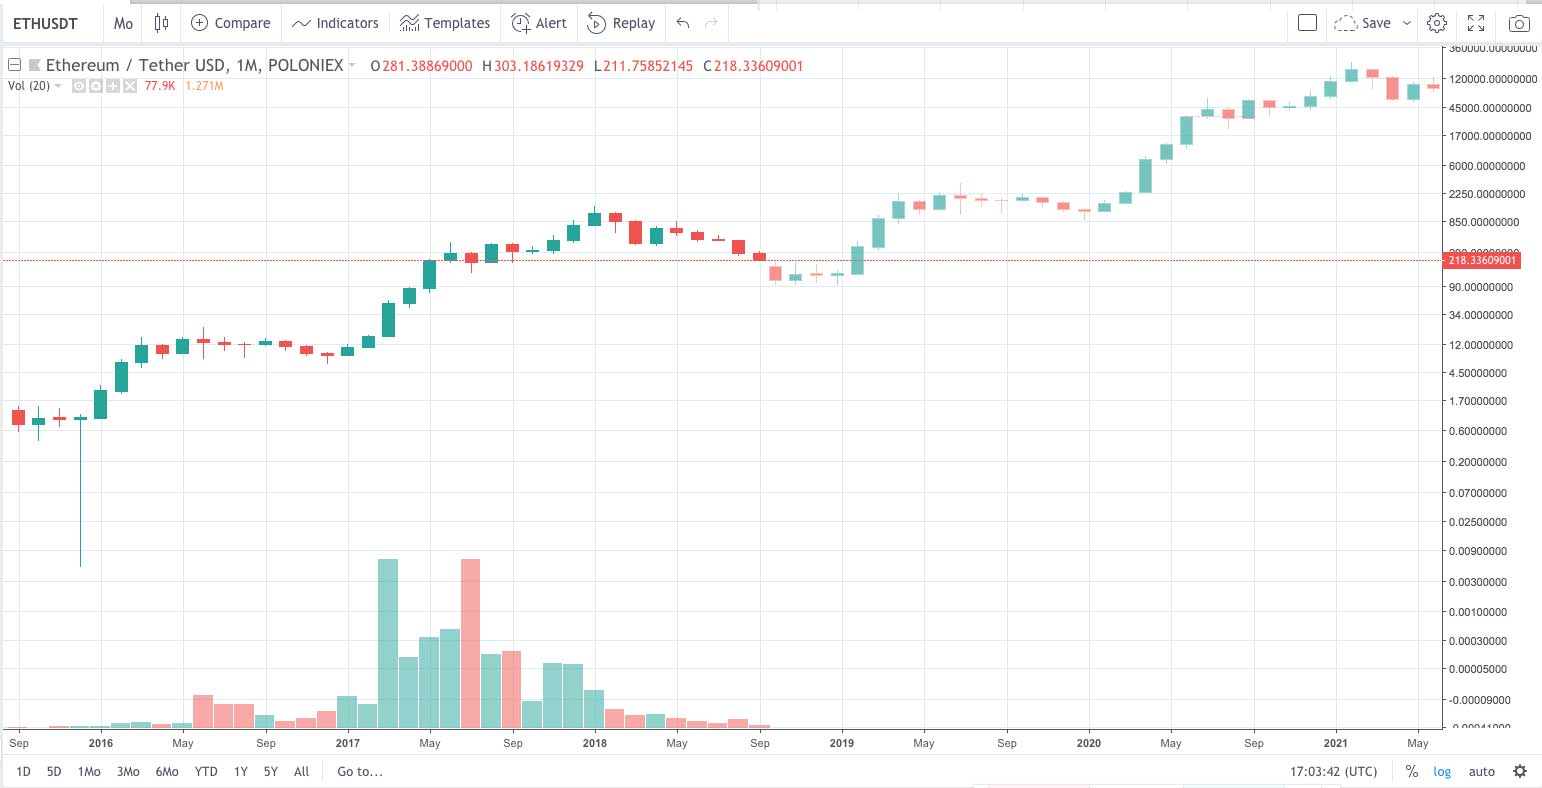
What if Ethereum ends up being a bullish fractal? In other words, what if the pattern on the log chart keeps repeating? So far, so good on Ether fractals.

What if ETH is a bullish fractal all the way up? This is the definition of a long shot.
I sketched out what I mean roughly in the pictures above. The idea would be that the pattern up until now plays out over and over.
Even if this was the case, ETH could fall all the way to around $80 – $100 before rebounding, and then somehow by the grace of the moon Gods end up going past $10k!

This might seem crazy, but Bitcoin went to $20k after going to $1,400 and falling to $150 in 2013 – 2014 (not too different from what ETH is doing now), AND Bitcoin has thus far in its history been this type of bullish fractal with these size jumps.
Below is the log chart of Bitcoin I stitched together from the MtGox days until now (forgive copy paste job, I studied under CNBC Fast Money’s Intern… by lurking on his Coinbase doodles).
Point being. Bitcoin is essentially a bullish fractal from 2010 – 2018, and ETH already has been a bullish fractal up to this point…. so even though things have lots of room to get dark, there precedent is there for, as they say in the biz, “moon” or as I like to call them “bullish moon fractals.”
NOTE: To be super clear, the trend is currently bearish and thus one should assume the trend will remain bearish. Hopes, dreams, and “what ifs” are fun, but in general it is smart to protect your capital and never risk more than you can afford to lose (see a page on risk management). Also keep in mind that a logarithmic chart is essentially exponential, so there are some problems with patterns repeating forever when considered against the total money supply in the world’s economy.

Bitcoin is essentially a bullish log fractal, 2010 – 2018… you know, so far.