What the Bull Run From 2015 – 2017 Looked Like Compared to 2019
Drops of about 38% were common in the Bitcoin bun run of 2015 – 2017. In other words, Bitcoin commonly retraced to the .382 fib level. Could the same happen in 2019?
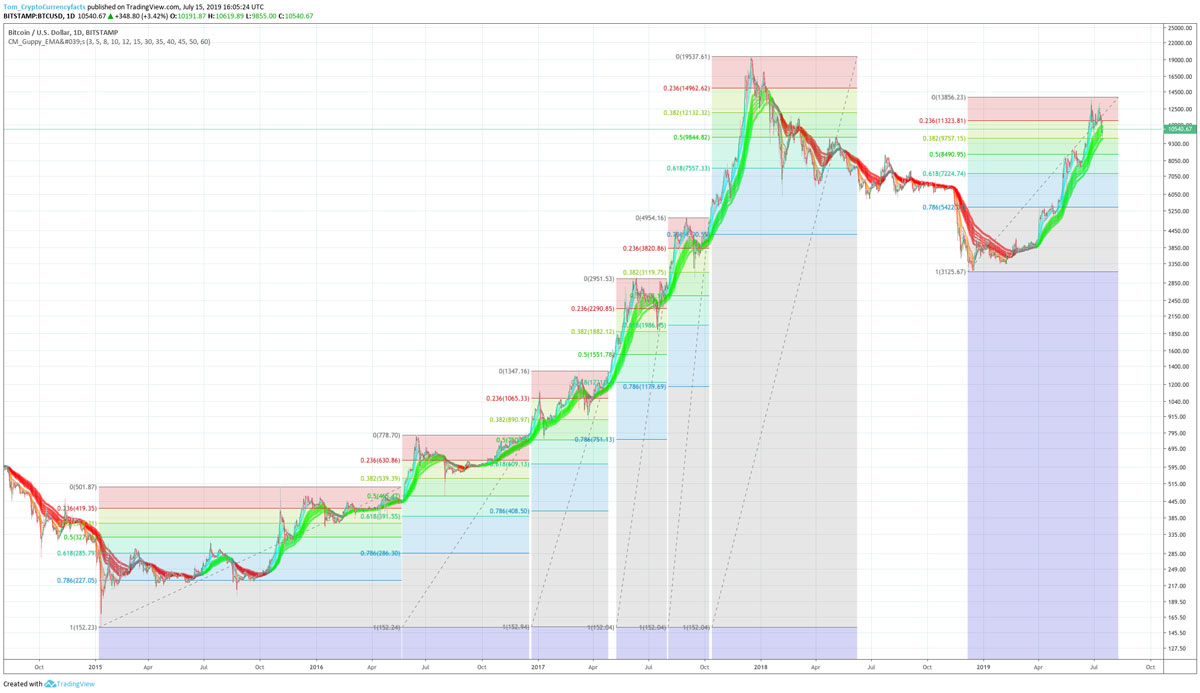
Measuring from the low of 2018 to the top so far of 2019, as seen in the chart above, we can see the .382 has so far acted as support.
Looking at the chart below, which illustrates the fib levels of more moves, we can see one wick down to the .5 (a 50% retracement).

Looking then at the chart above we can see that once in a while we did also get a retracement to the point 5, for example a quick wick down in August 2016.
In short, it is common to see retracements to the .382 (about a 38% correction), and every so often also a quick wick down to the .5 (about a 50%) retracement, in Bitcoin bull markets.
Thus, so far, we still have a price structure that could be seen as being part of a new bull market based on historical price trends.

Bitcoin Fibonacci retracements for 2019 by fib level.
Author: Thomas DeMichele
Thomas DeMichele has been working in the cryptocurrency information space since 2015 when CryptocurrencyFacts.com was created. He has contributed to MakerDAO, Alpha Bot (the number one crypto bot on Discord),...
Thomas DeMichele's Full Bio