Bitcoin is Arguably Back in Bull Mode After Correcting for the Second Half of 2019
Bitcoin is arguably back in bull mode after correcting for the second half of 2019.
A section focused on technical analysis. Any article that looks at charts or talks about how to look at charts can be found here.
Please note we don’t do price targets on this site, we do educational content focused on learning about the basics of technical analysis.
With that in mind you’ll find two types of content here:
Discussions about the fundamentals of the technicals and resources. Things like “what is technical analysis,” “how to use Trading View,” and “how to use moving averages in crypto.”
Educational and informational looks at historic, current, and potential crypto charts (sometimes compared to non-crypto charts). So things like “a comparison of 2014 and 2018,” or comparing the tech bubble to the crypto bubble,” or “bulls need to ward off this death cross or it won’t be a good look technically speaking; Let’s take a look at what death crosses mean.”
NOTE: This content is meant to be informational and educational; it is not investing advice. That said, here is some free life advice, as a general rule of thumb don’t make important financial decisions based on information you find on the internet… ?
Bitcoin is arguably back in bull mode after correcting for the second half of 2019.
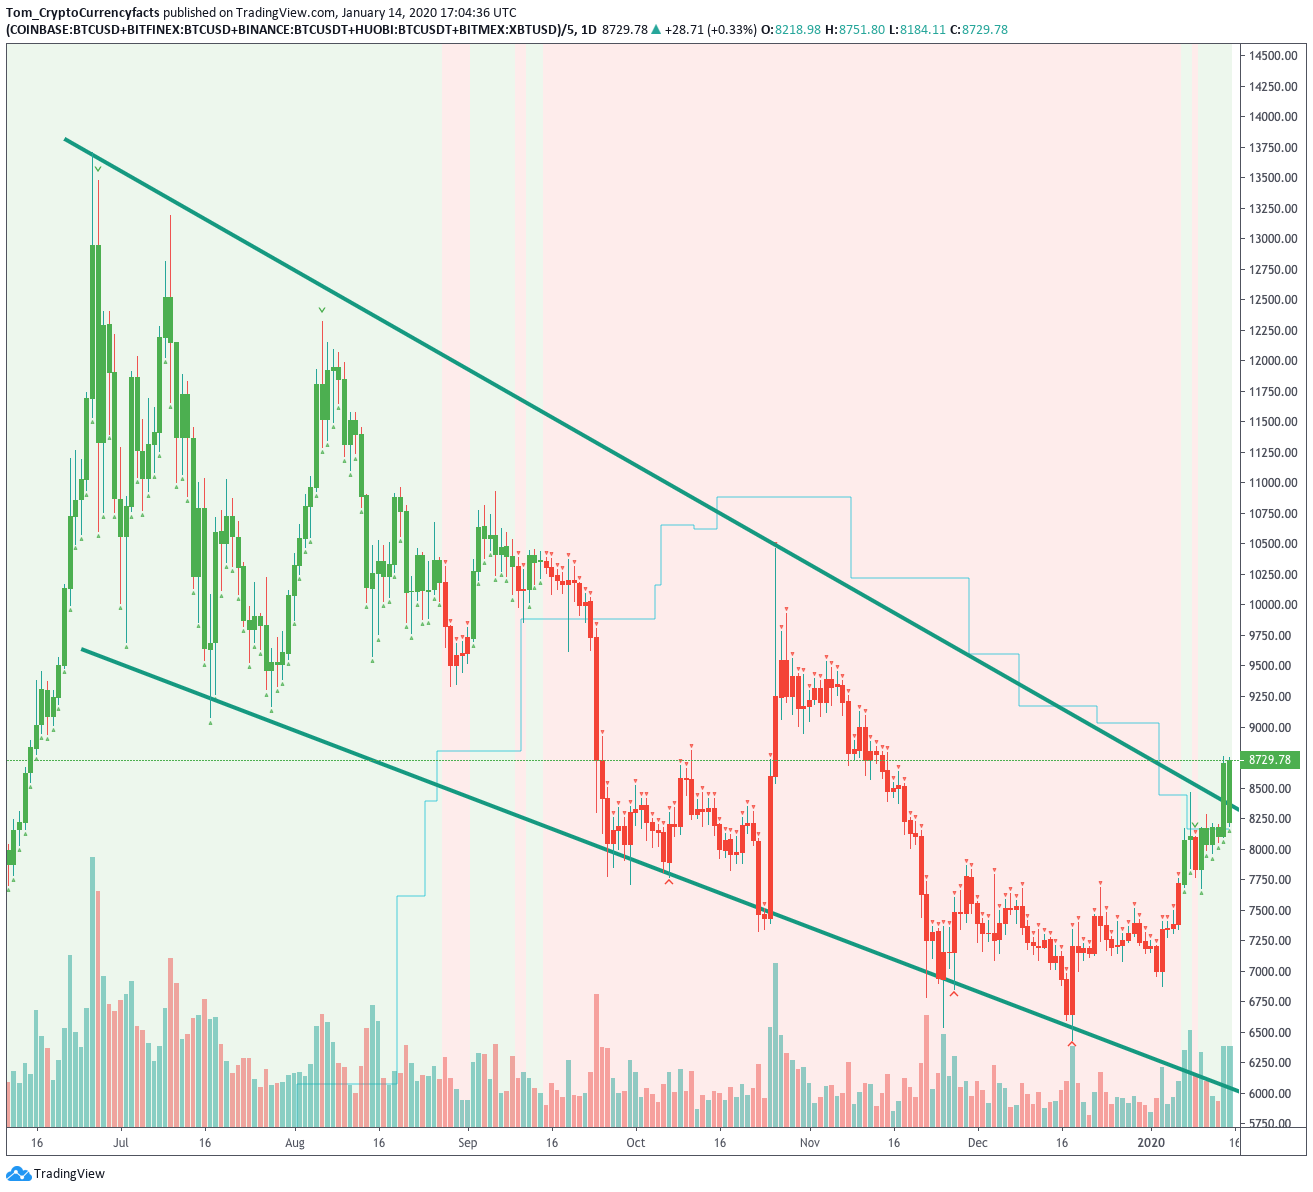
The crypto market is lighting up green with BCH, BSV, and DASH making notable runs as Bitcoin breaks out of its downtrend channel.
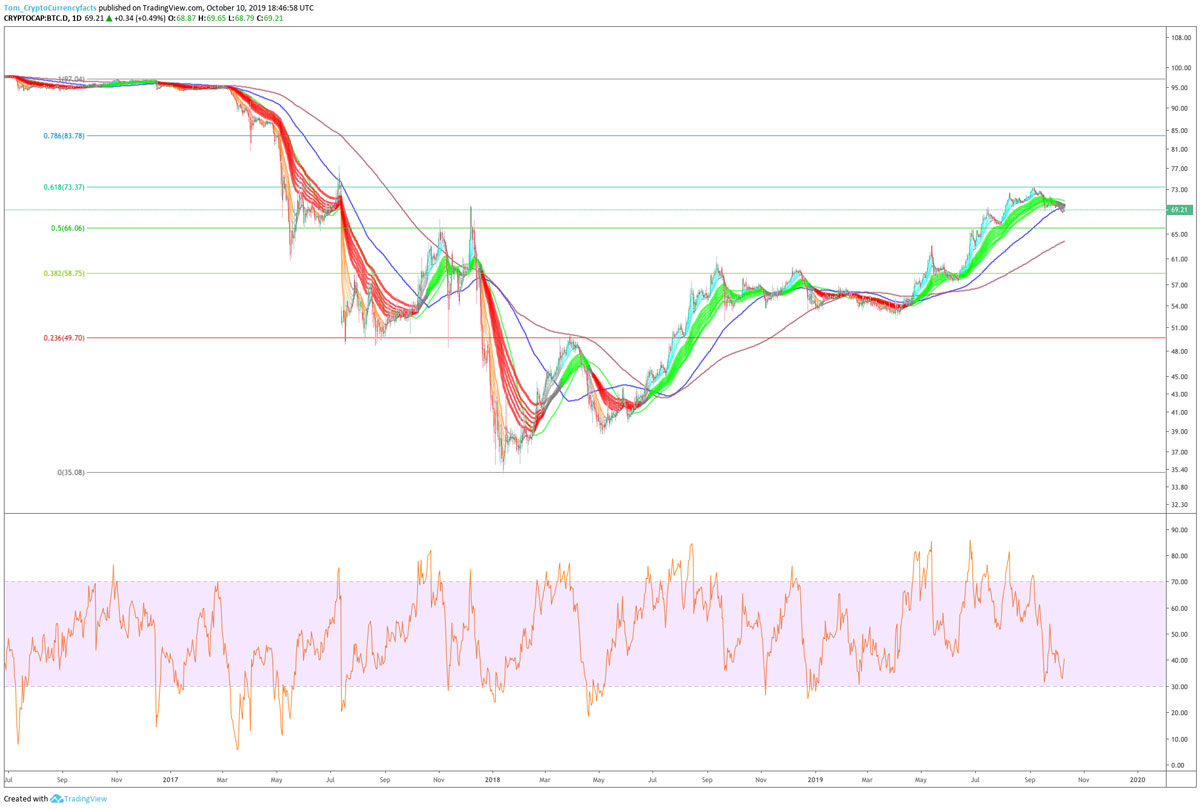
One way to try to predict when the next alt season will come is to look at the Bitcoin Dominance chart. Specifically a downtrend in the dominance chart means alt season is on.
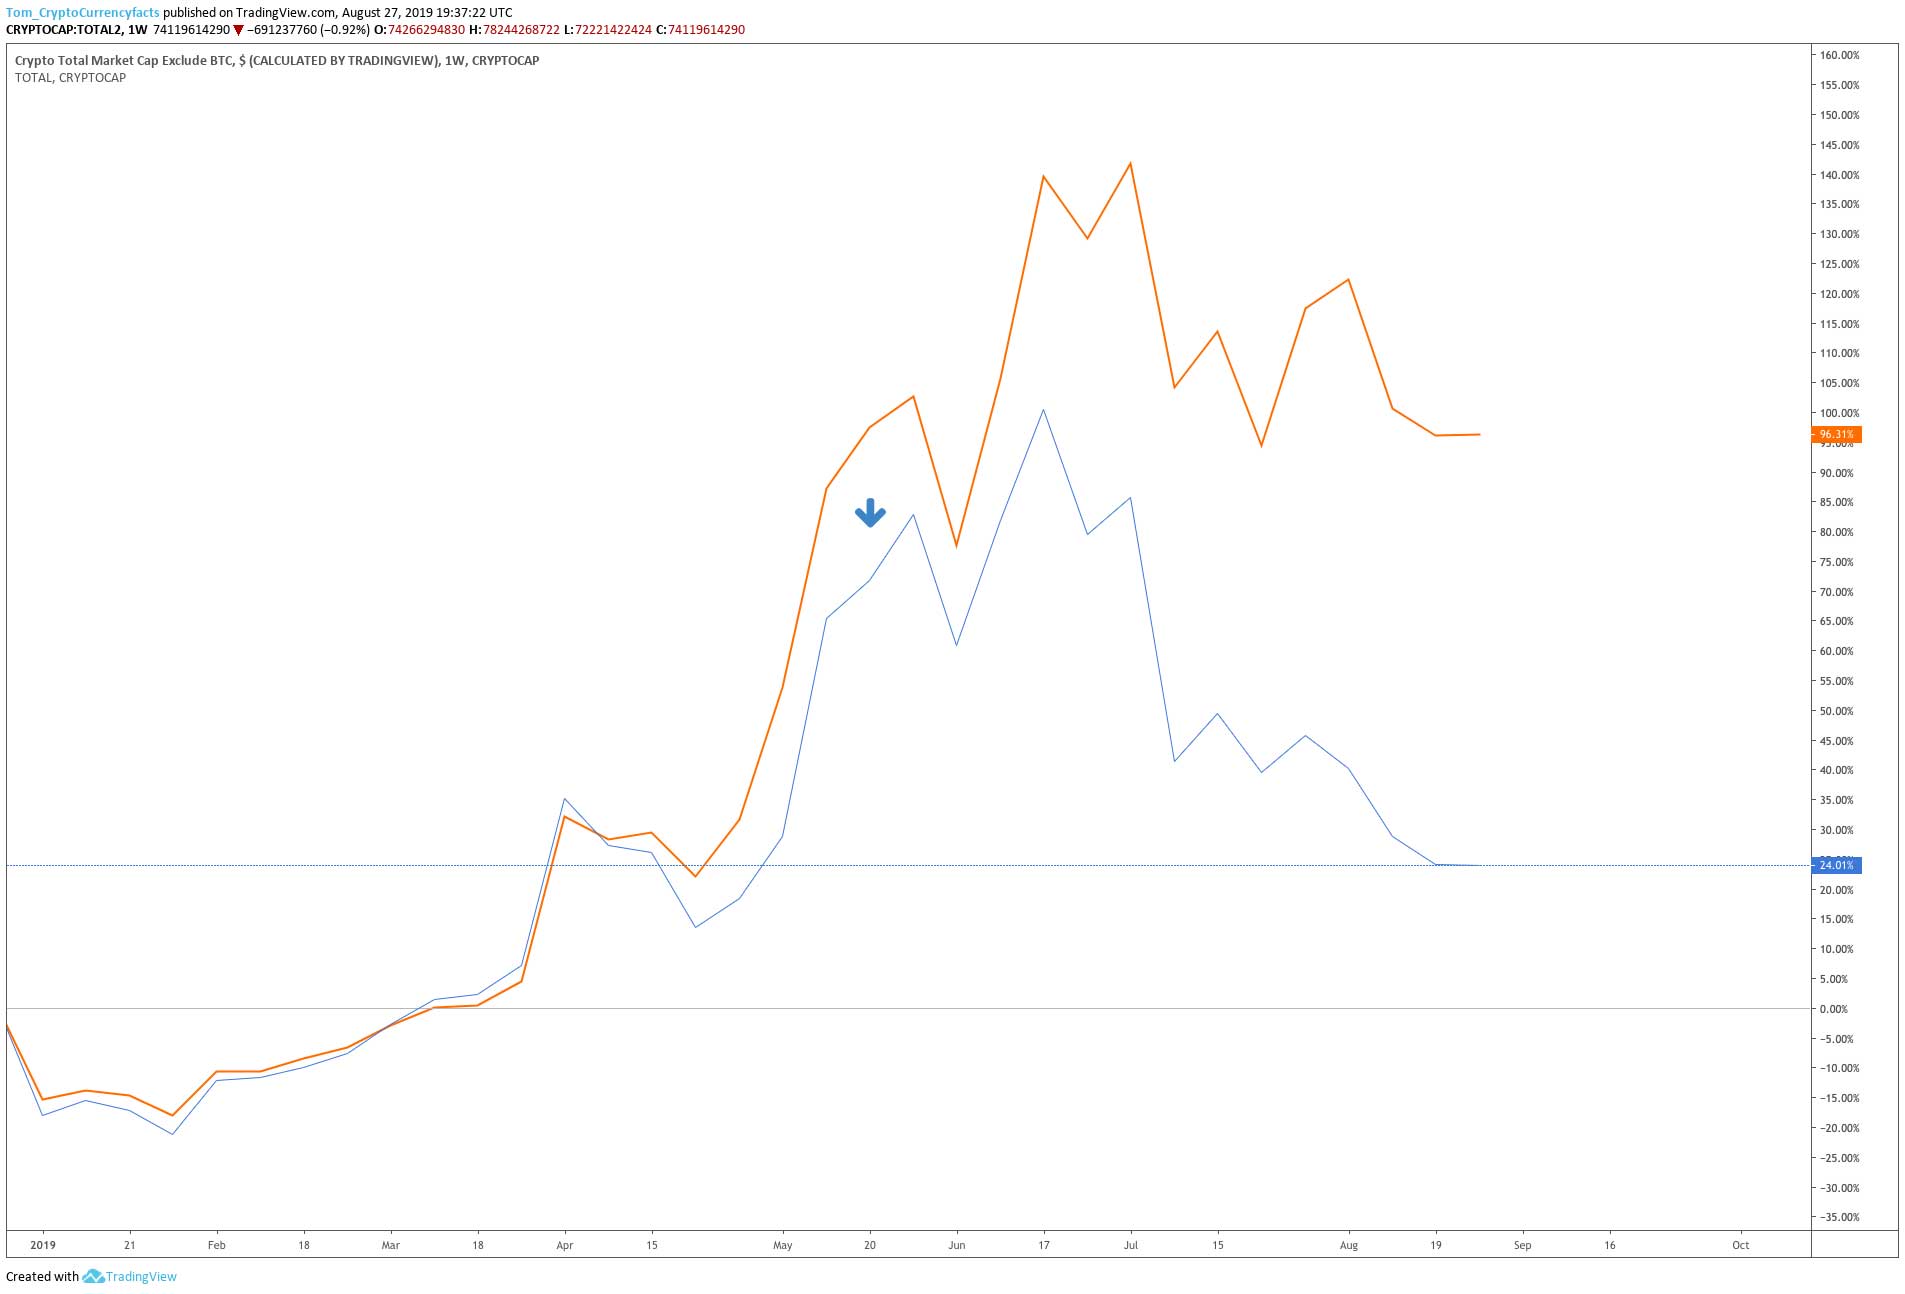
Poloniex blocking US customers on May 16th started an altcoins slump. Will the last of the geoblocks by Binance on Sept 1st cause an altcoin pump?
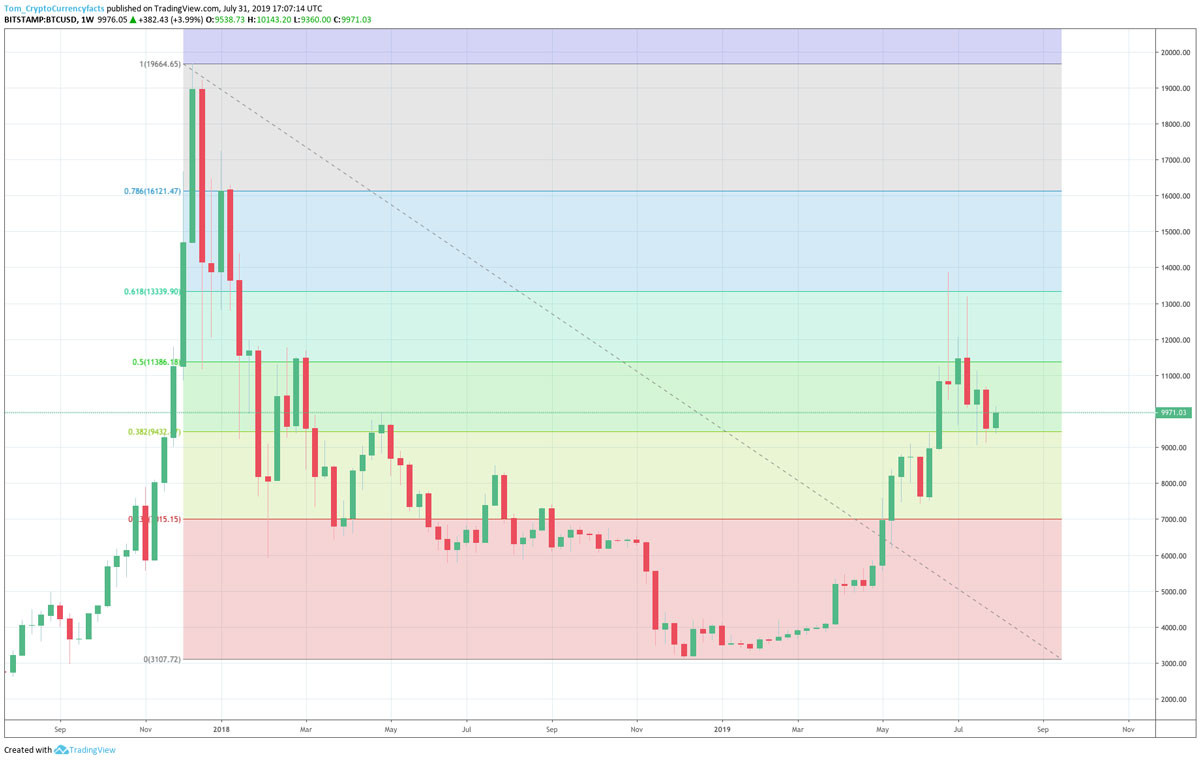
BTC has been consolidating on top of the 0.382 fib after pulling back in from the 0.618 in 2019 measuring from the top of the 2017 bubble to the bottom in 2018.
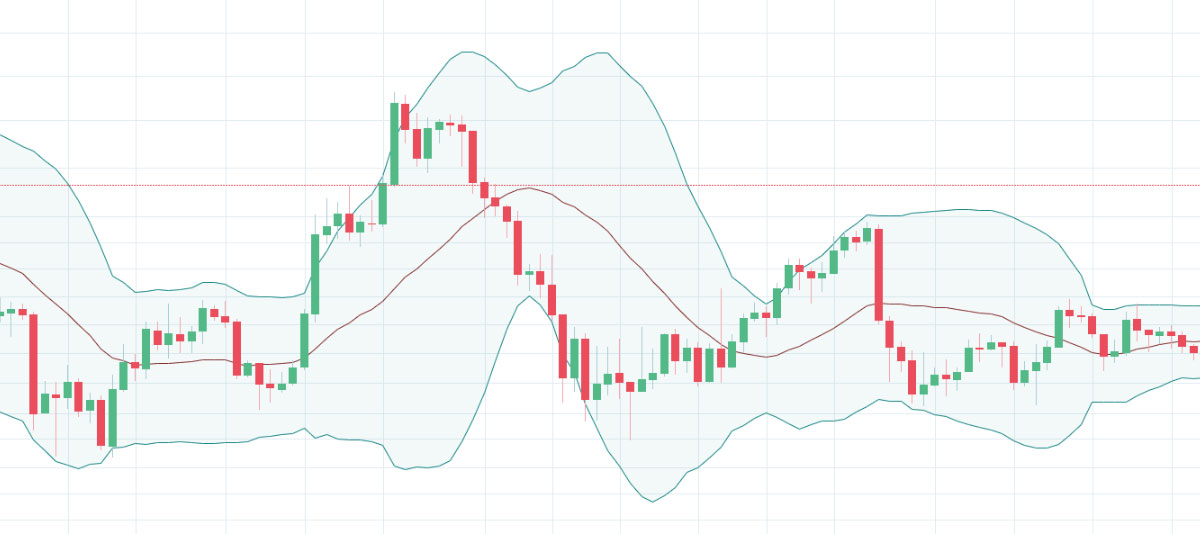
We discuss how to use Bollinger Bands for automated trading. The key to creating an effective Bollinger Band strategy is finding the right parameters.
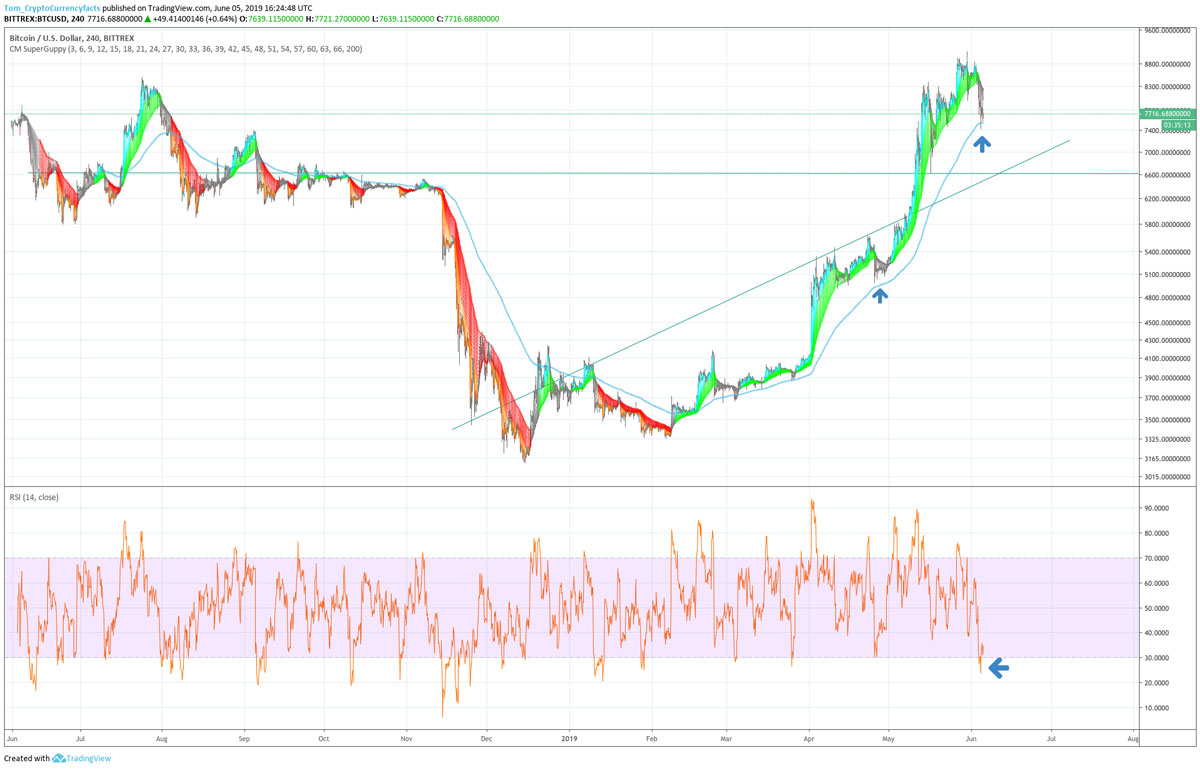
Up until last week or so it was very easy to argue that we started a new bull market, and that it looked like the bottom is in. Now we have a needed correction. This correction will be a good test of the bull.
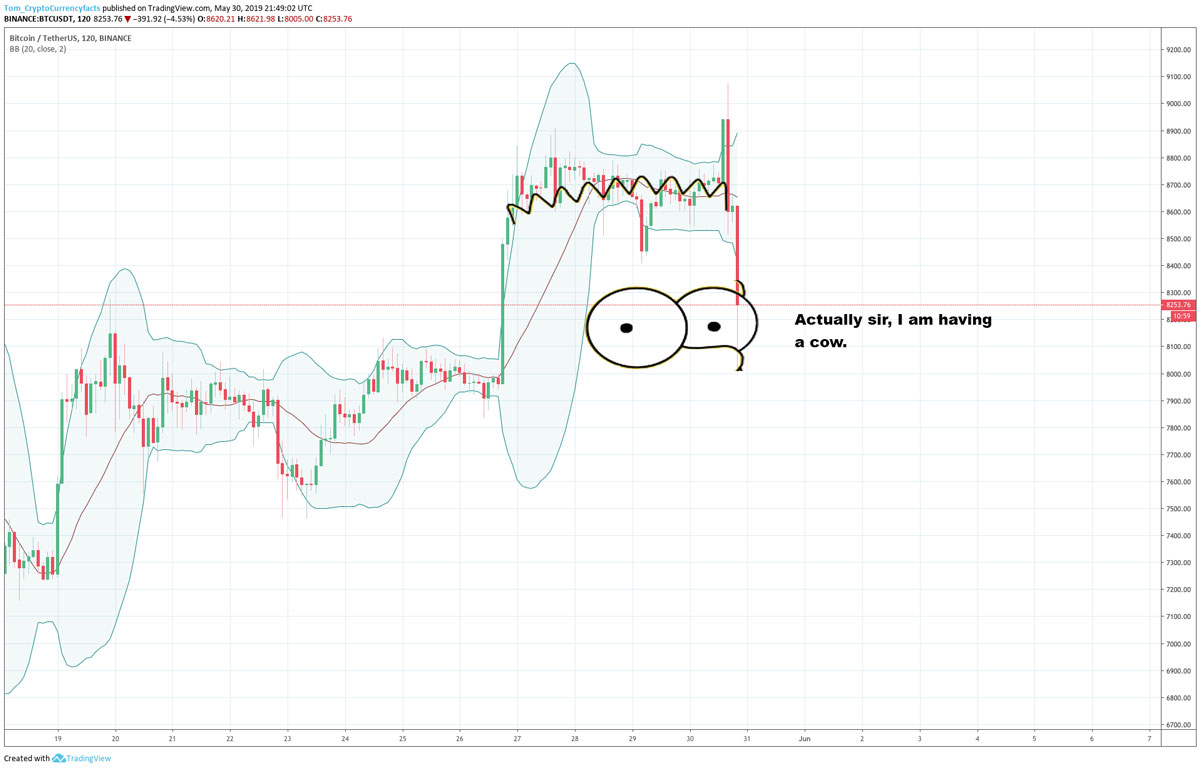
Bitcoin (BTC) did a classic Bart from May 26th to May 30th. A Bart is a crypto pattern that includes one big green candle and one big red candle of equal magnitude.
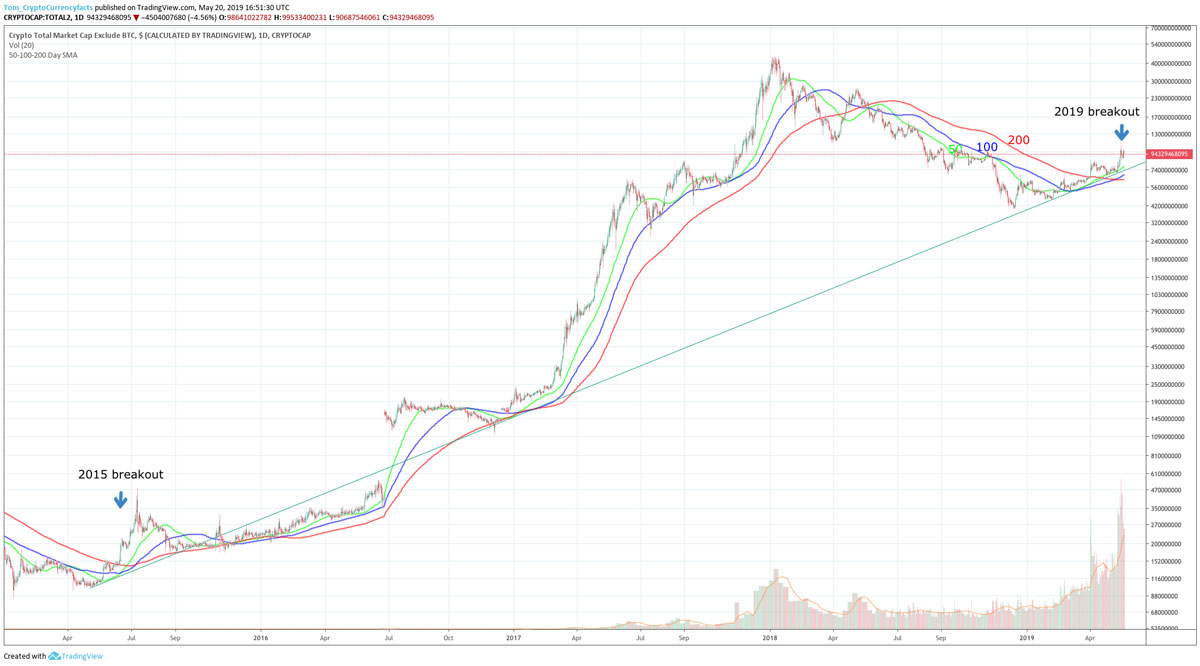
The total crypto market cap excluding BTC is actually in a longterm uptrend since 2015, and after a brutal 2018, back in an uptrend in 2019 as well.
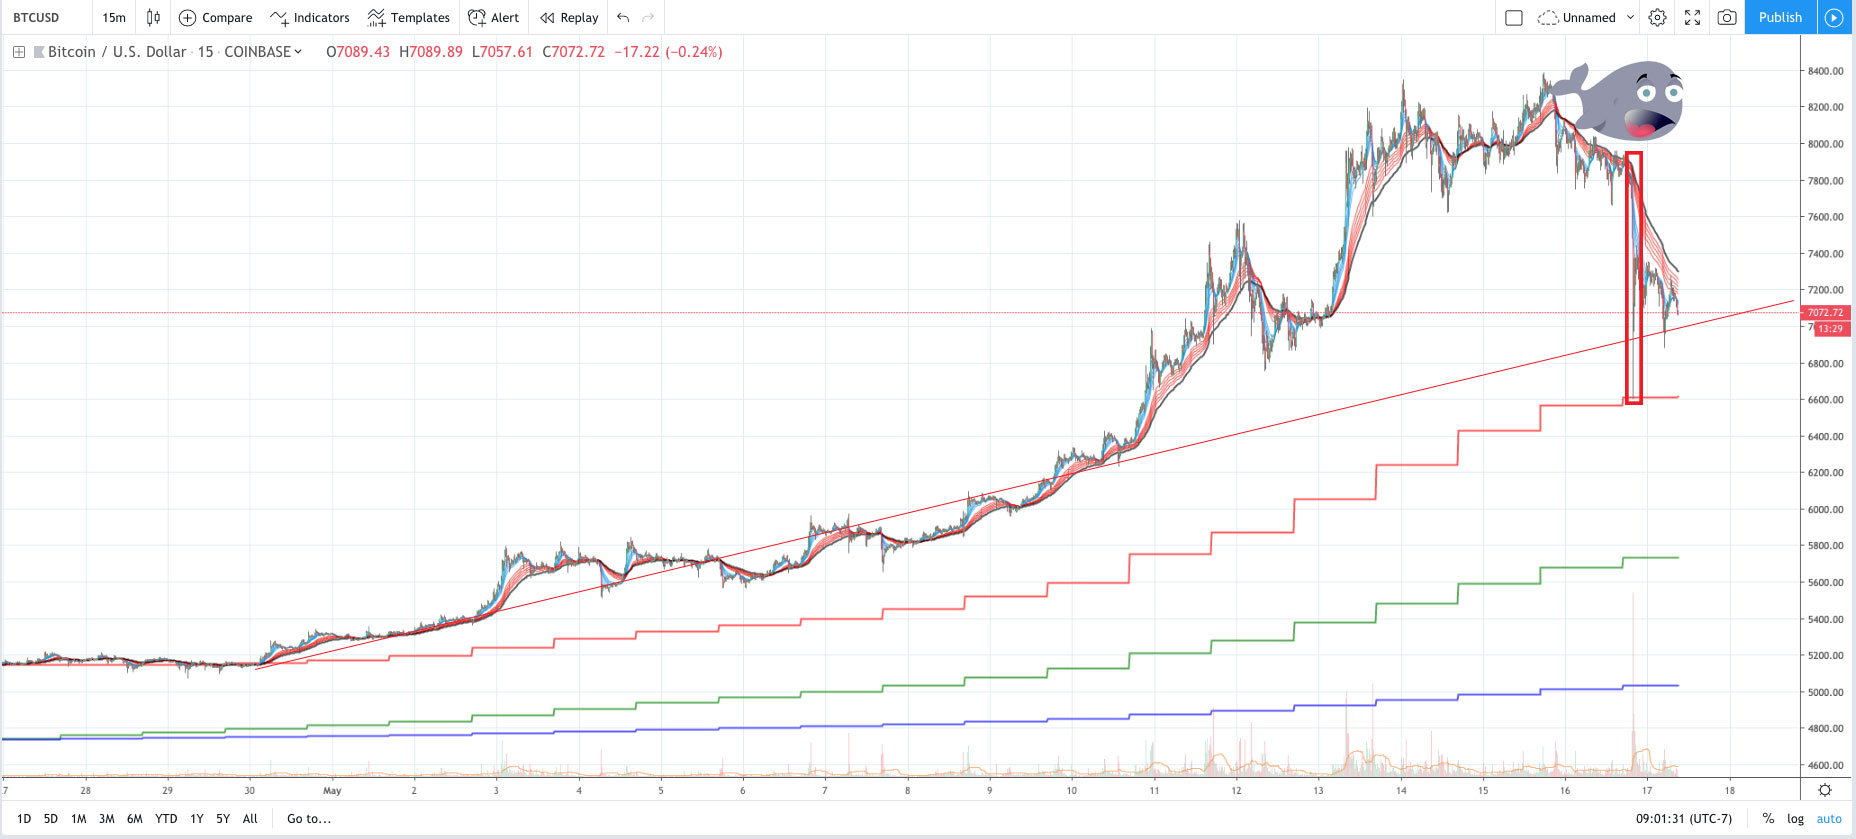
We hadn’t had anything that looked like a bull run in crypto until recently, now we have that typical sizable crypto correction (brought on by a quick dump). Will this dip be bought, or will we see 2018 style panic selling?
By continuing to use the site, you agree to the use of cookies. more information
The cookie settings on this website are set to "allow cookies" to give you the best browsing experience possible. If you continue to use this website without changing your cookie settings or you click "Accept" below then you are consenting to this.