First Notable Crypto Correction of 2019 Tests the Bull Market Theory
Up until last week or so it was very easy to argue that we started a new bull market, and that it looked like the bottom is in. Now we have a needed correction. This correction will be a good test of the bull.
In a crypto bull market corrections can be deep and harsh, but they always resolve into a continuation of the uptrend.
It is only in crypto bear markets and bottoms that we get a full retrace or a correction leads to more downside.

Thus, the nature and character of this correction, and of course the price action afterwords, will tell us a lot about the current state of the market.
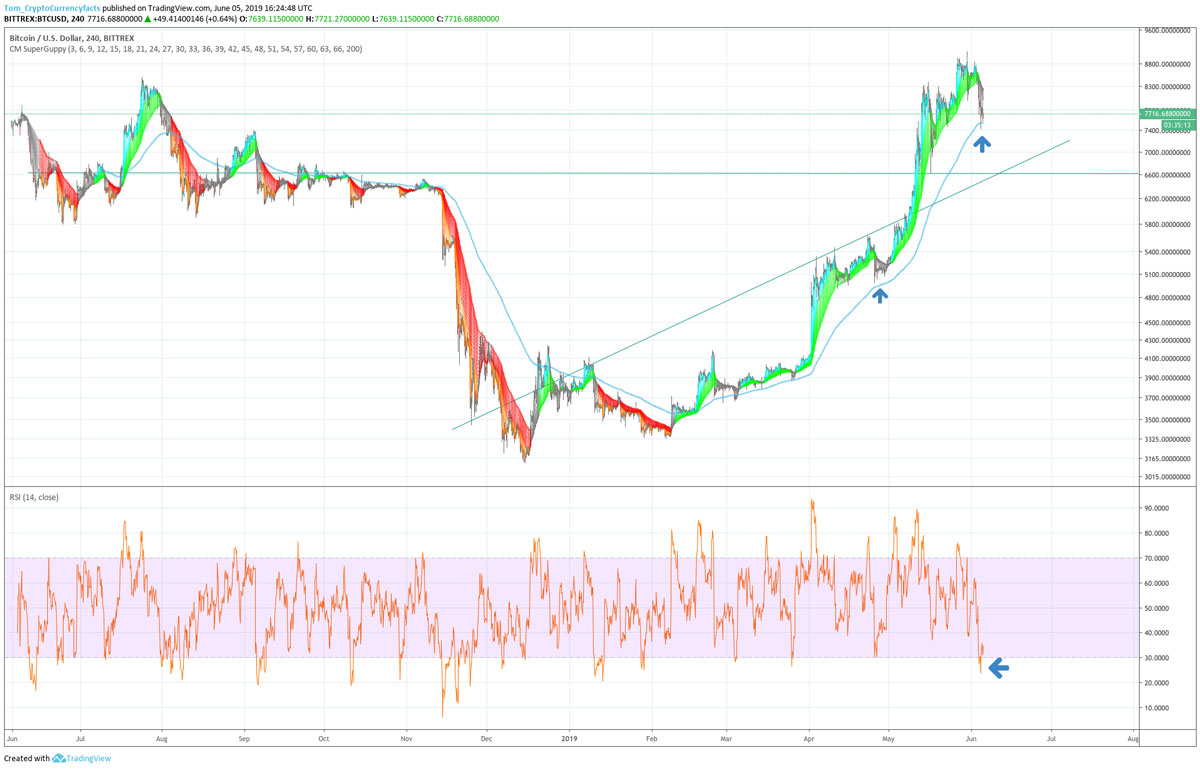
There are many different ways to look at chart, but one such way is shown above. In this chart, we can see Bitcoin has been in an uptrend with most of its short term moving averages crossed over its long term ones since it formed a local bottom in late 2018 – 2019.
We can also see in the chart that we have had the one of the harshest (if not the harshest) correction in terms of deviation from the trend recently. This was true to the extent that the 4 hour RSI actually got oversold and the price action broke below a number of shorter term moving averages.
If we come out of this like we did the other more minor corrections, and especially if alts can keep their strength up, this is a great sign for the bulls. If the sell pressure brings us down and we pop back from that while retaining the uptrend, that is also good for the bulls. If this turns into a 2018 style sell off, that is very bad news. The character of 2018-style sell offs was different than 2013, 2016, and 2017 bull market sell offs, so we want to see a bull market style sell of and not a bear market one.
On that note, if BTC can manage to hold above the uptrend despite some correction, watch for strength in alts. One notable feature of this correction is that alts have barely given anything back in terms of BTC prices. The fact that alts didn’t drop harder than BTC is a rather bullish sign for alts.
TIP: If you want another view of BTC, try this chart that shows the 50, 100, and 200 day SMAs. These SMAs should work as supports if we break through the supports denoted in the chart above. The chart above illustrates short term trends on a 4 hour scale, the 50, 100, and 200 are longer term trends on a daily scale.
Author: Thomas DeMichele
Thomas DeMichele has been working in the cryptocurrency information space since 2015 when CryptocurrencyFacts.com was created. He has contributed to MakerDAO, Alpha Bot (the number one crypto bot on Discord),...
Thomas DeMichele's Full Bio