LTC Breakout and the Amazing Powers of Charlie Lee
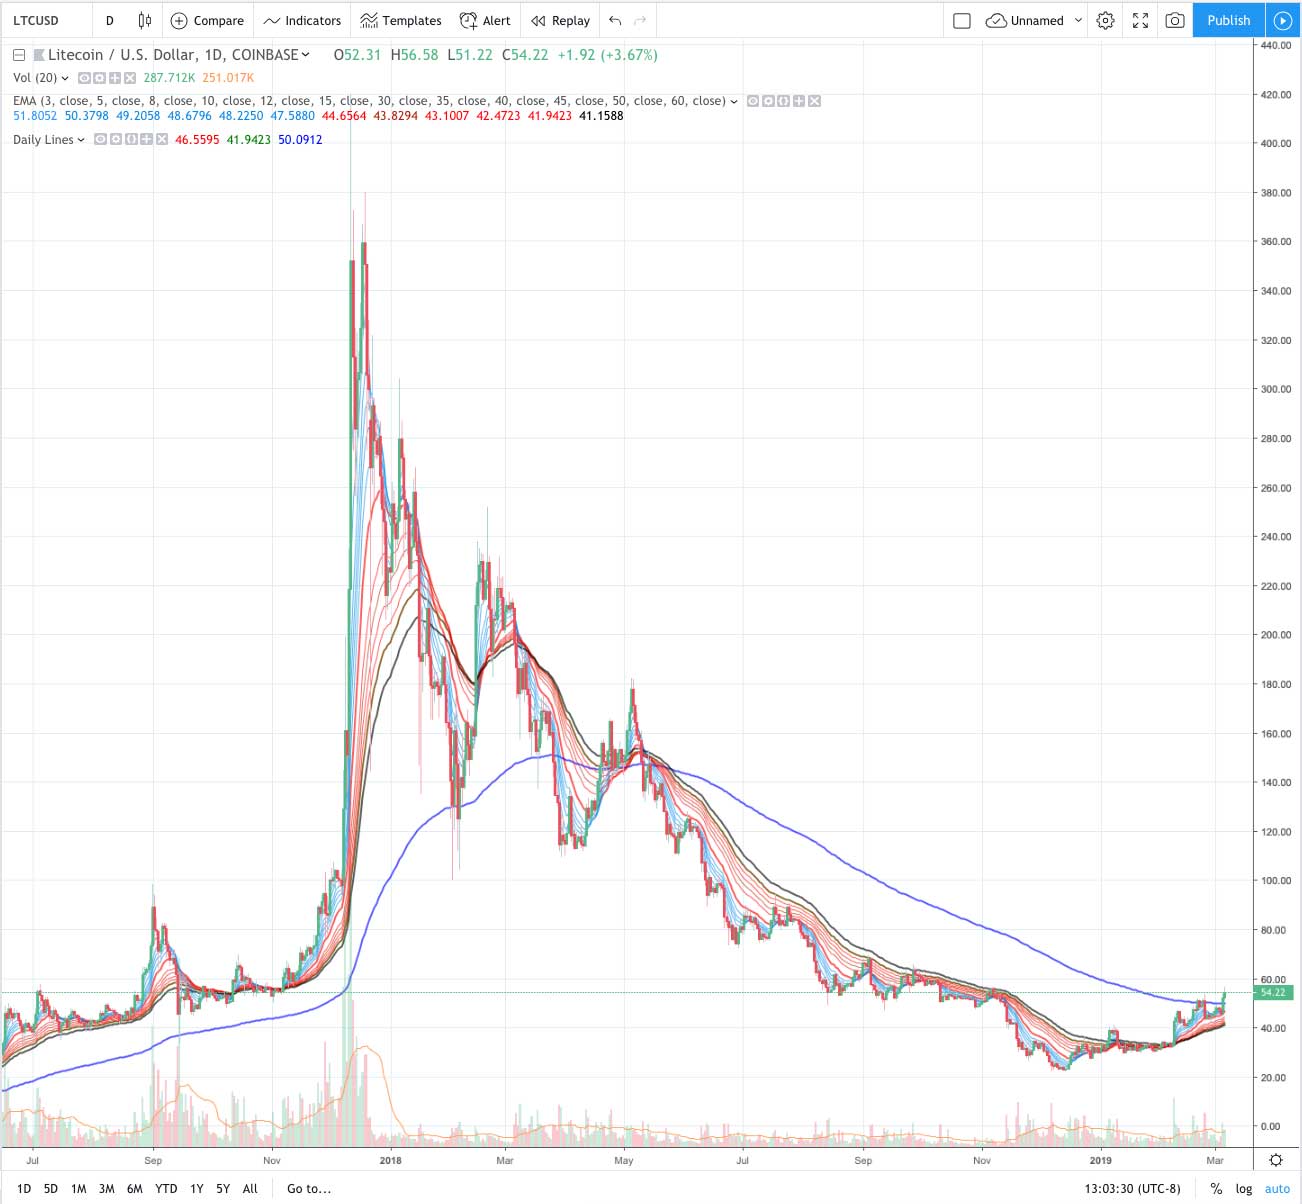
After almost hitting Charlie Lee’s price target, LTC has gone on to breakout of some key resistance here in 2019.
A section focused on technical analysis. Any article that looks at charts or talks about how to look at charts can be found here.
Please note we don’t do price targets on this site, we do educational content focused on learning about the basics of technical analysis.
With that in mind you’ll find two types of content here:
Discussions about the fundamentals of the technicals and resources. Things like “what is technical analysis,” “how to use Trading View,” and “how to use moving averages in crypto.”
Educational and informational looks at historic, current, and potential crypto charts (sometimes compared to non-crypto charts). So things like “a comparison of 2014 and 2018,” or comparing the tech bubble to the crypto bubble,” or “bulls need to ward off this death cross or it won’t be a good look technically speaking; Let’s take a look at what death crosses mean.”
NOTE: This content is meant to be informational and educational; it is not investing advice. That said, here is some free life advice, as a general rule of thumb don’t make important financial decisions based on information you find on the internet… ?

After almost hitting Charlie Lee’s price target, LTC has gone on to breakout of some key resistance here in 2019.
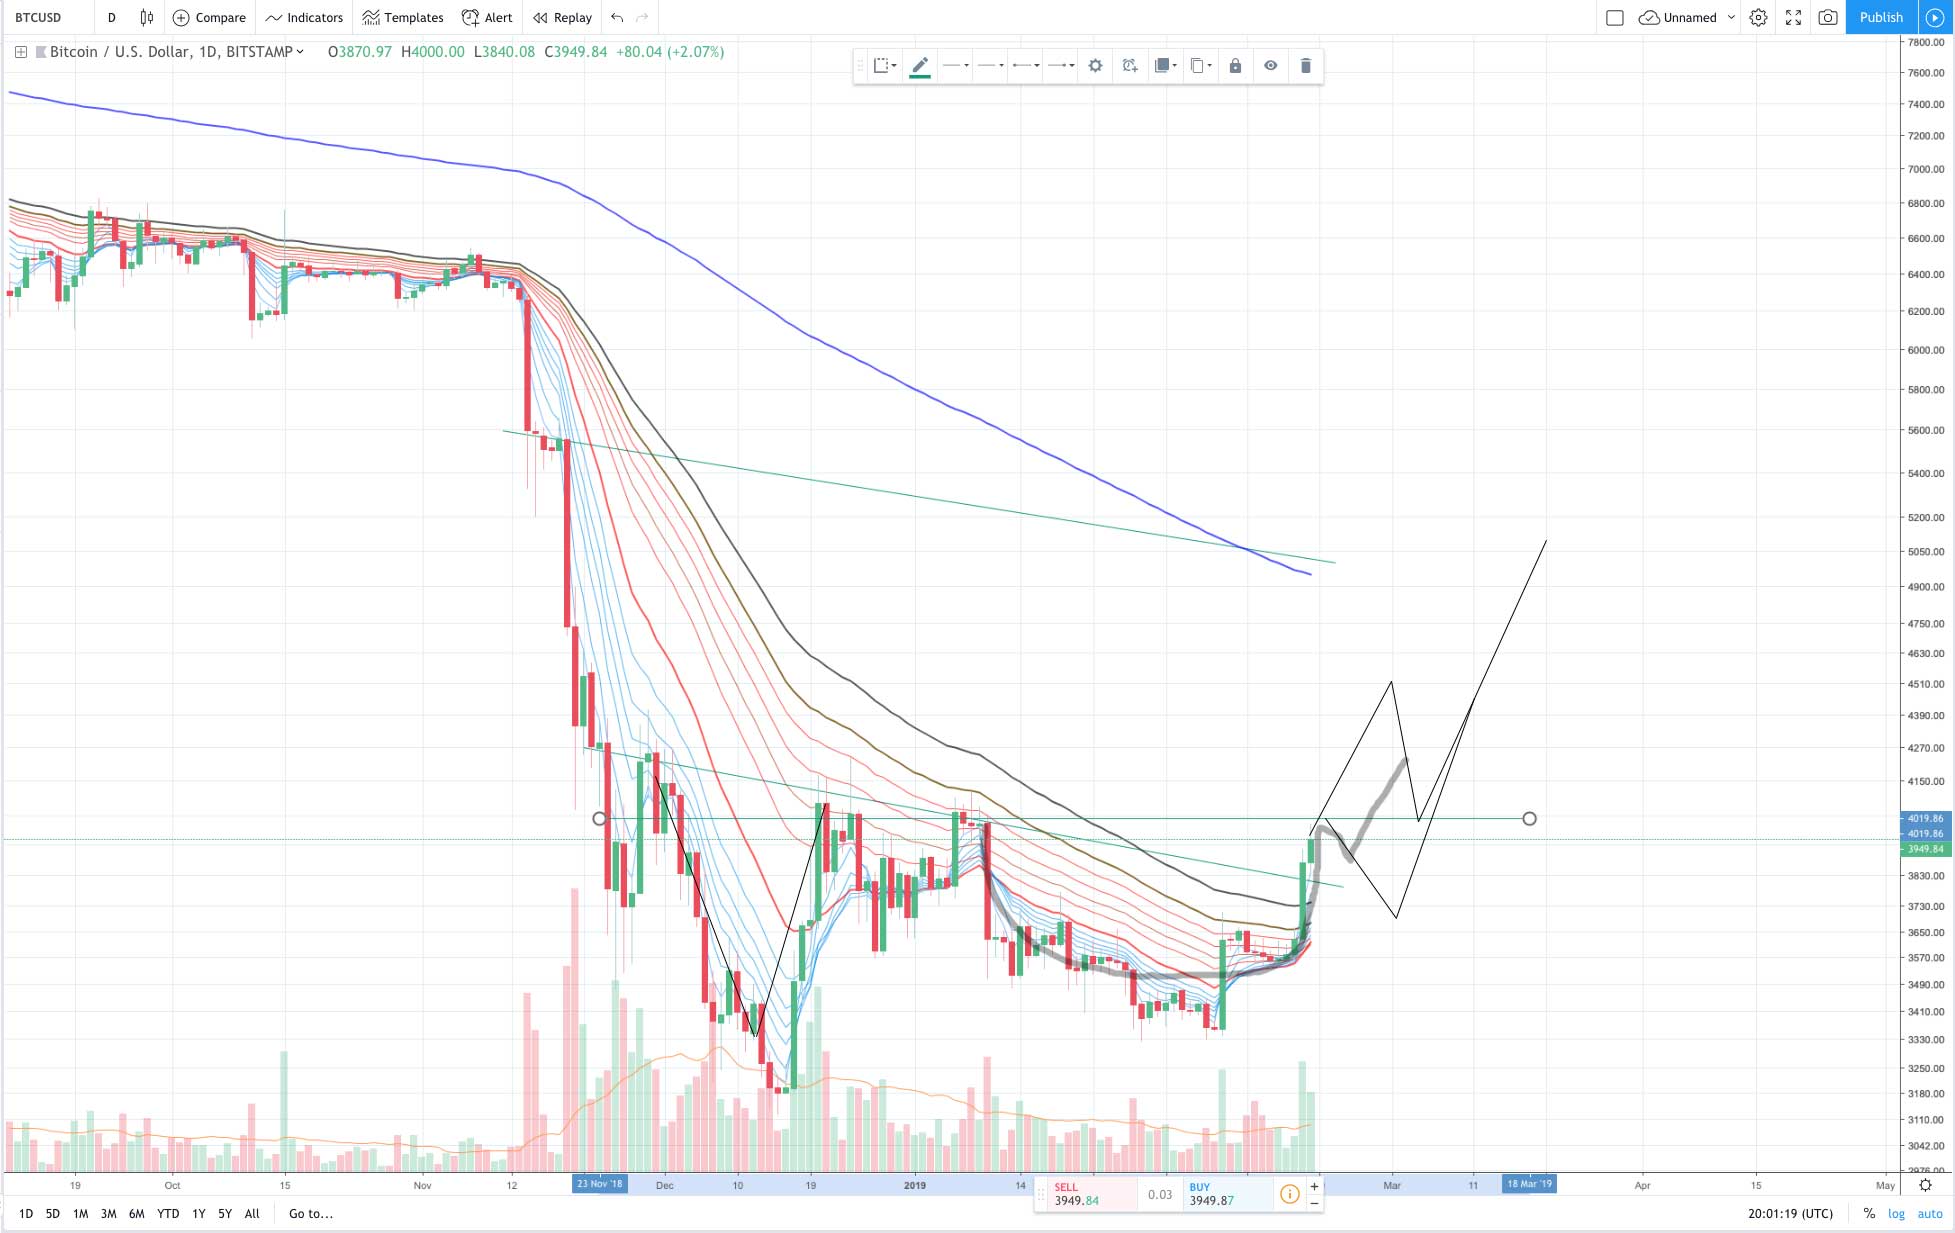
BTC has a bullish setup, that if not looked at in context of the long bear market, is pretty attractive. Is the new JPMorgan Coin bullish enough news to push it over the edge?
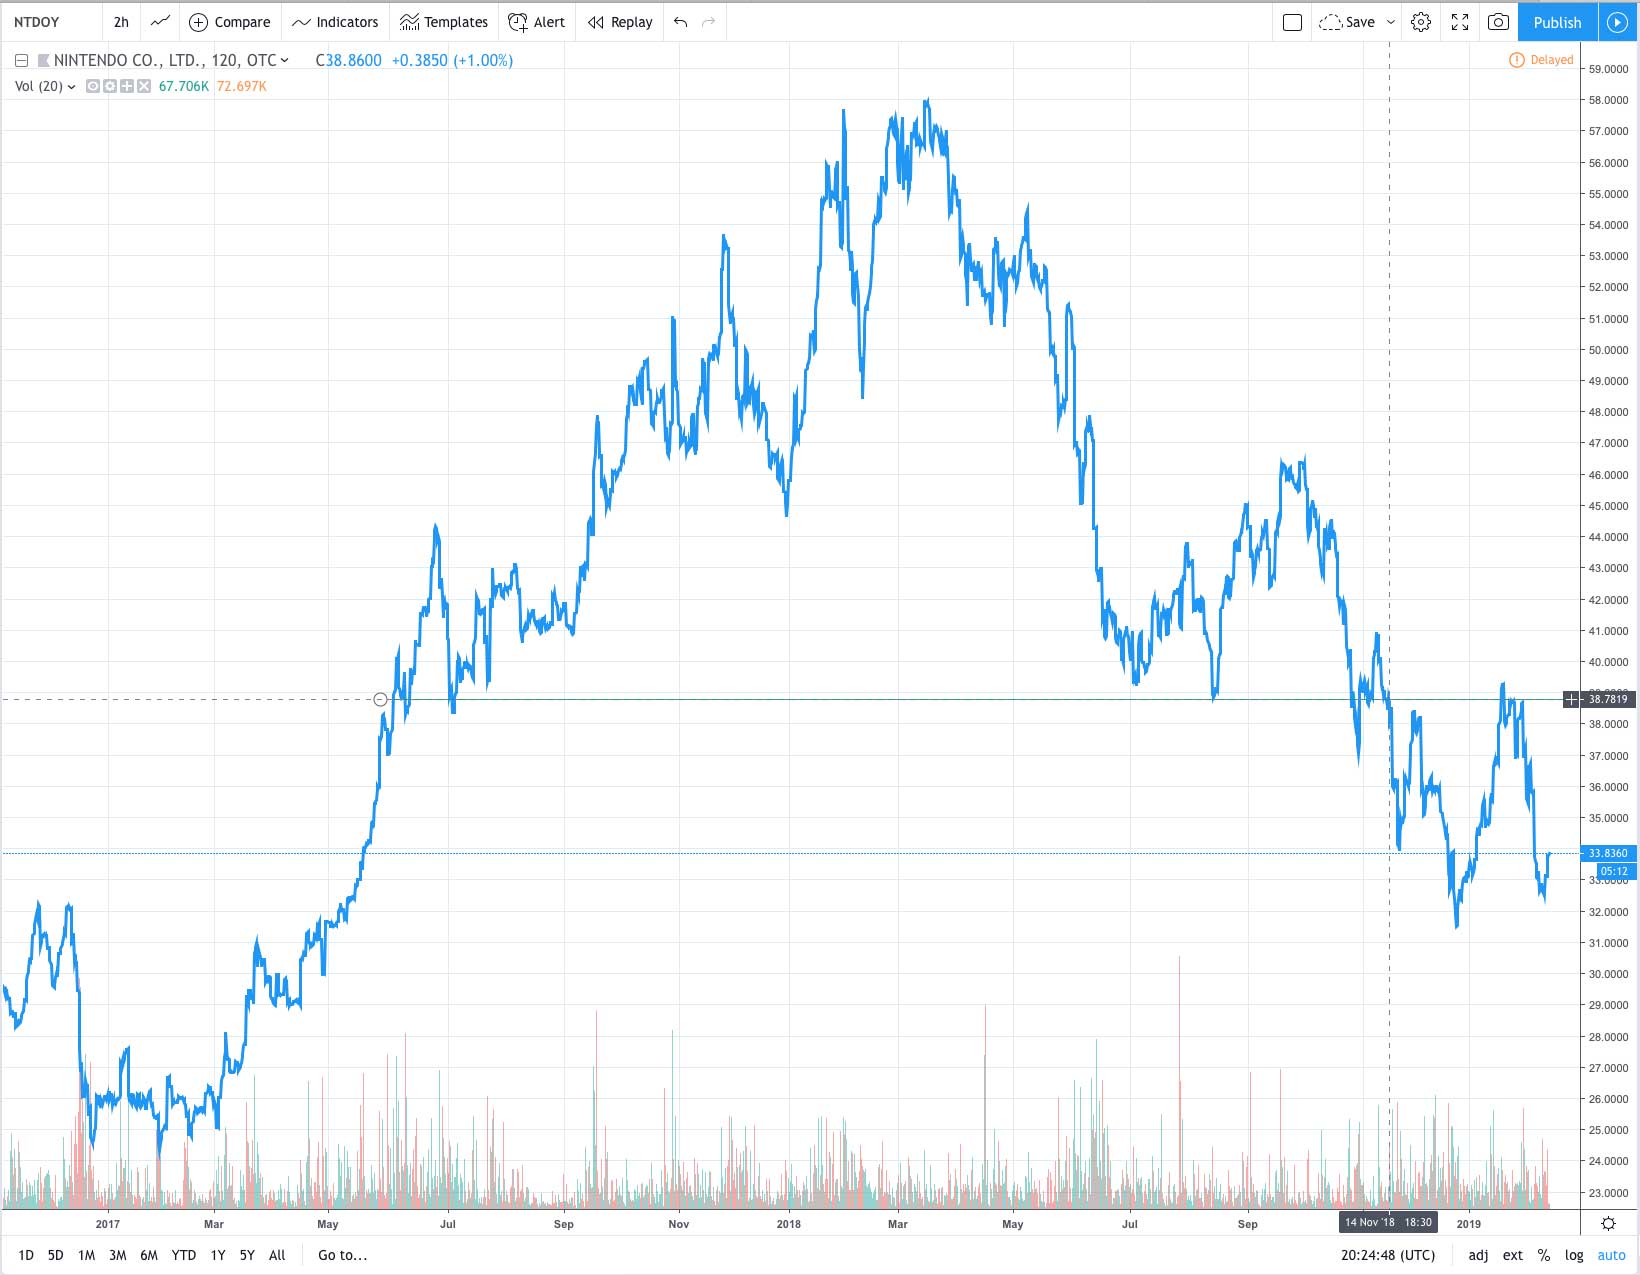
An S/R flip is a “support / resistance flip.” That is, when support becomes resistance or resistance becomes support (when support and resistance flip).
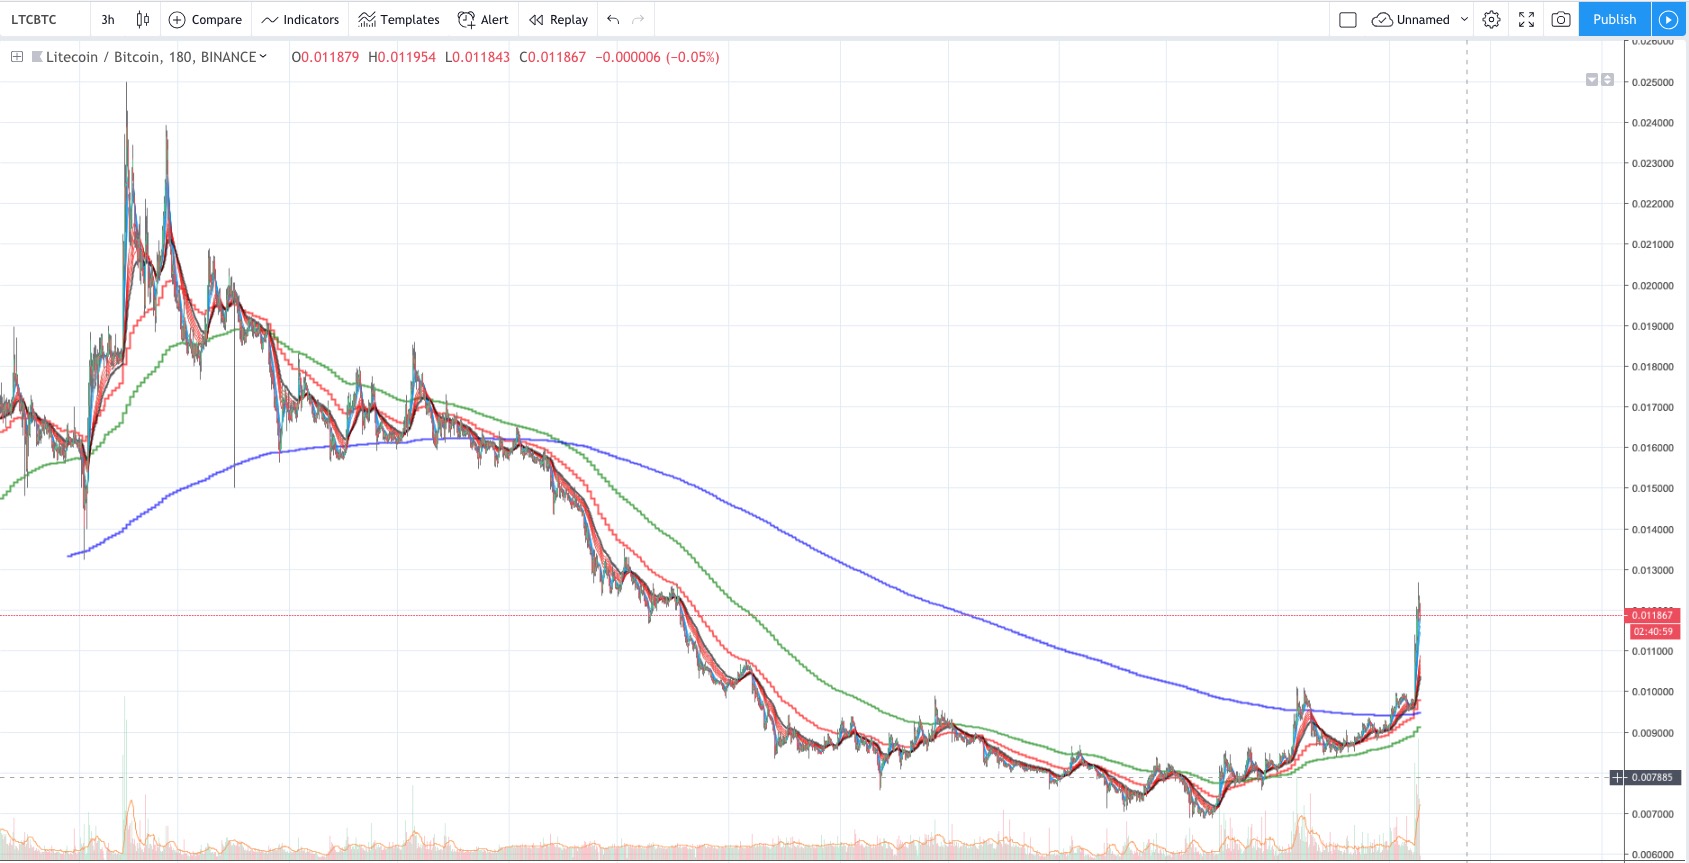
As you can see in the chart above, the LTC breakout looks solid in terms of price action against BTC.
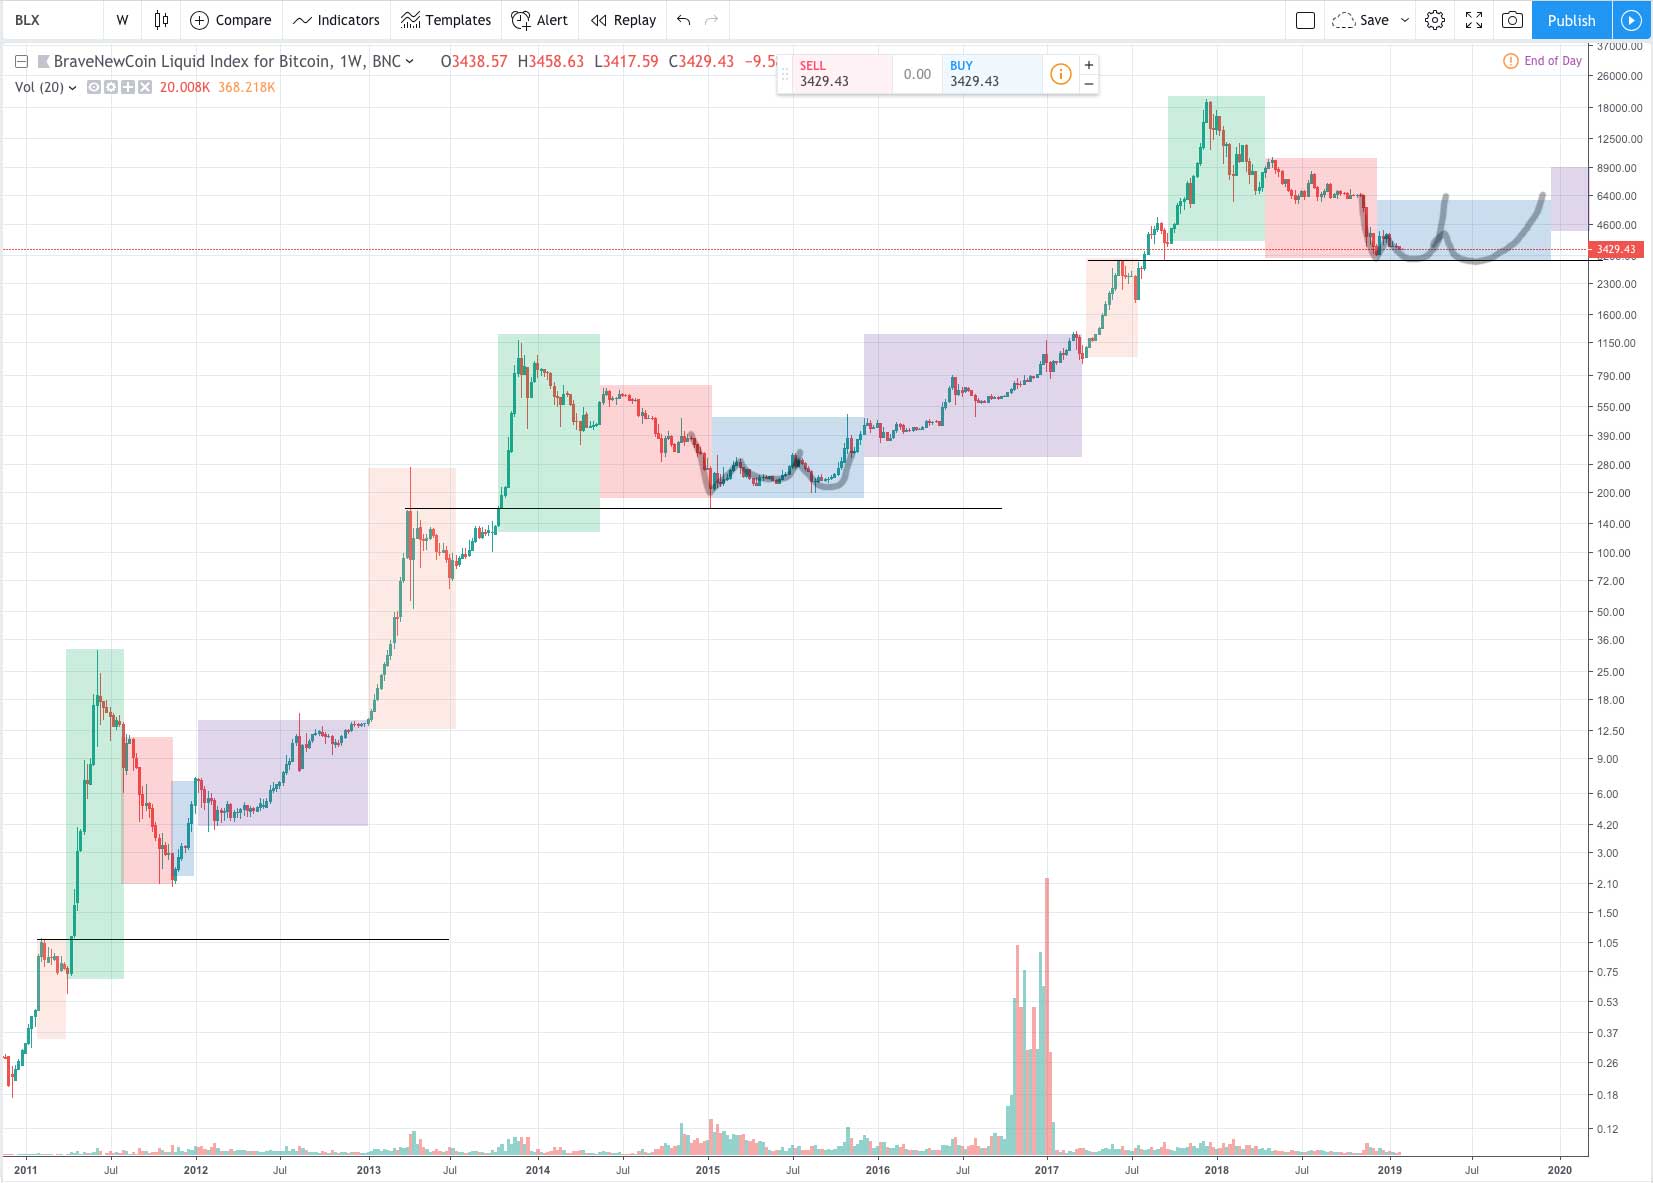
We look at BTC as a since 2011 here in 2019 to see if I can spot any potential patterns.
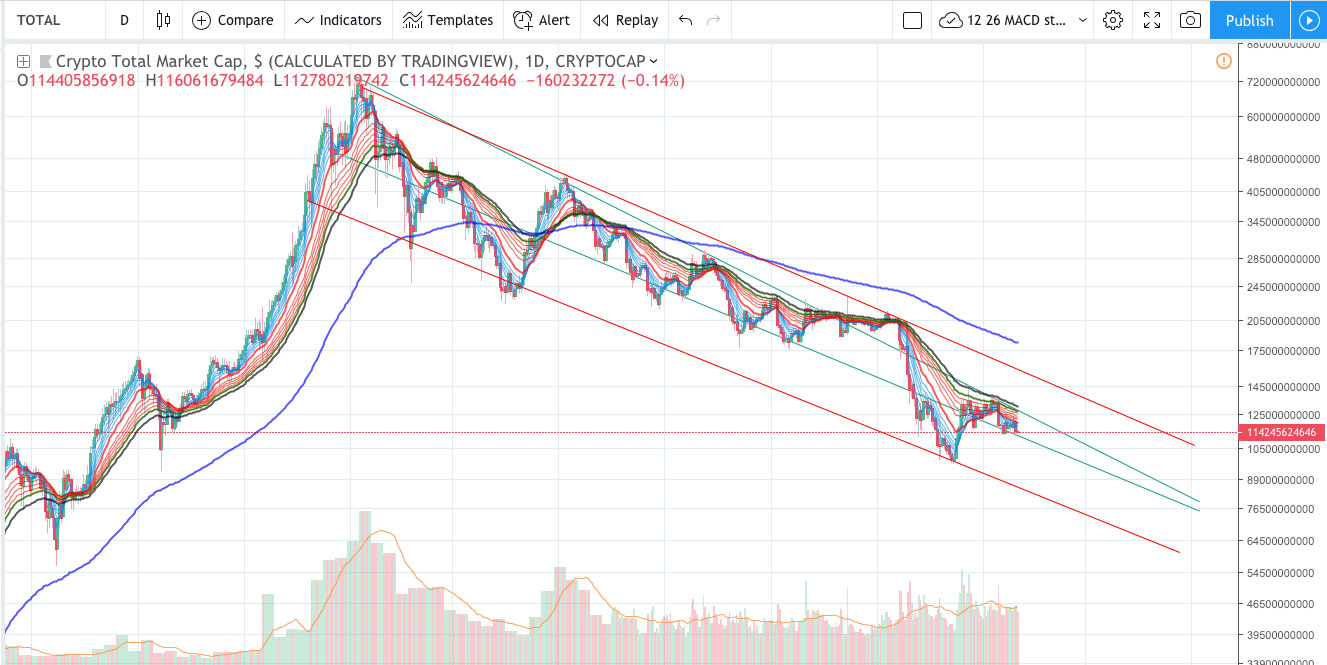
Crypto spent most of 2018 in a bear market. Unfortunately, 2019 has not been much different. We are still in a downtrend.
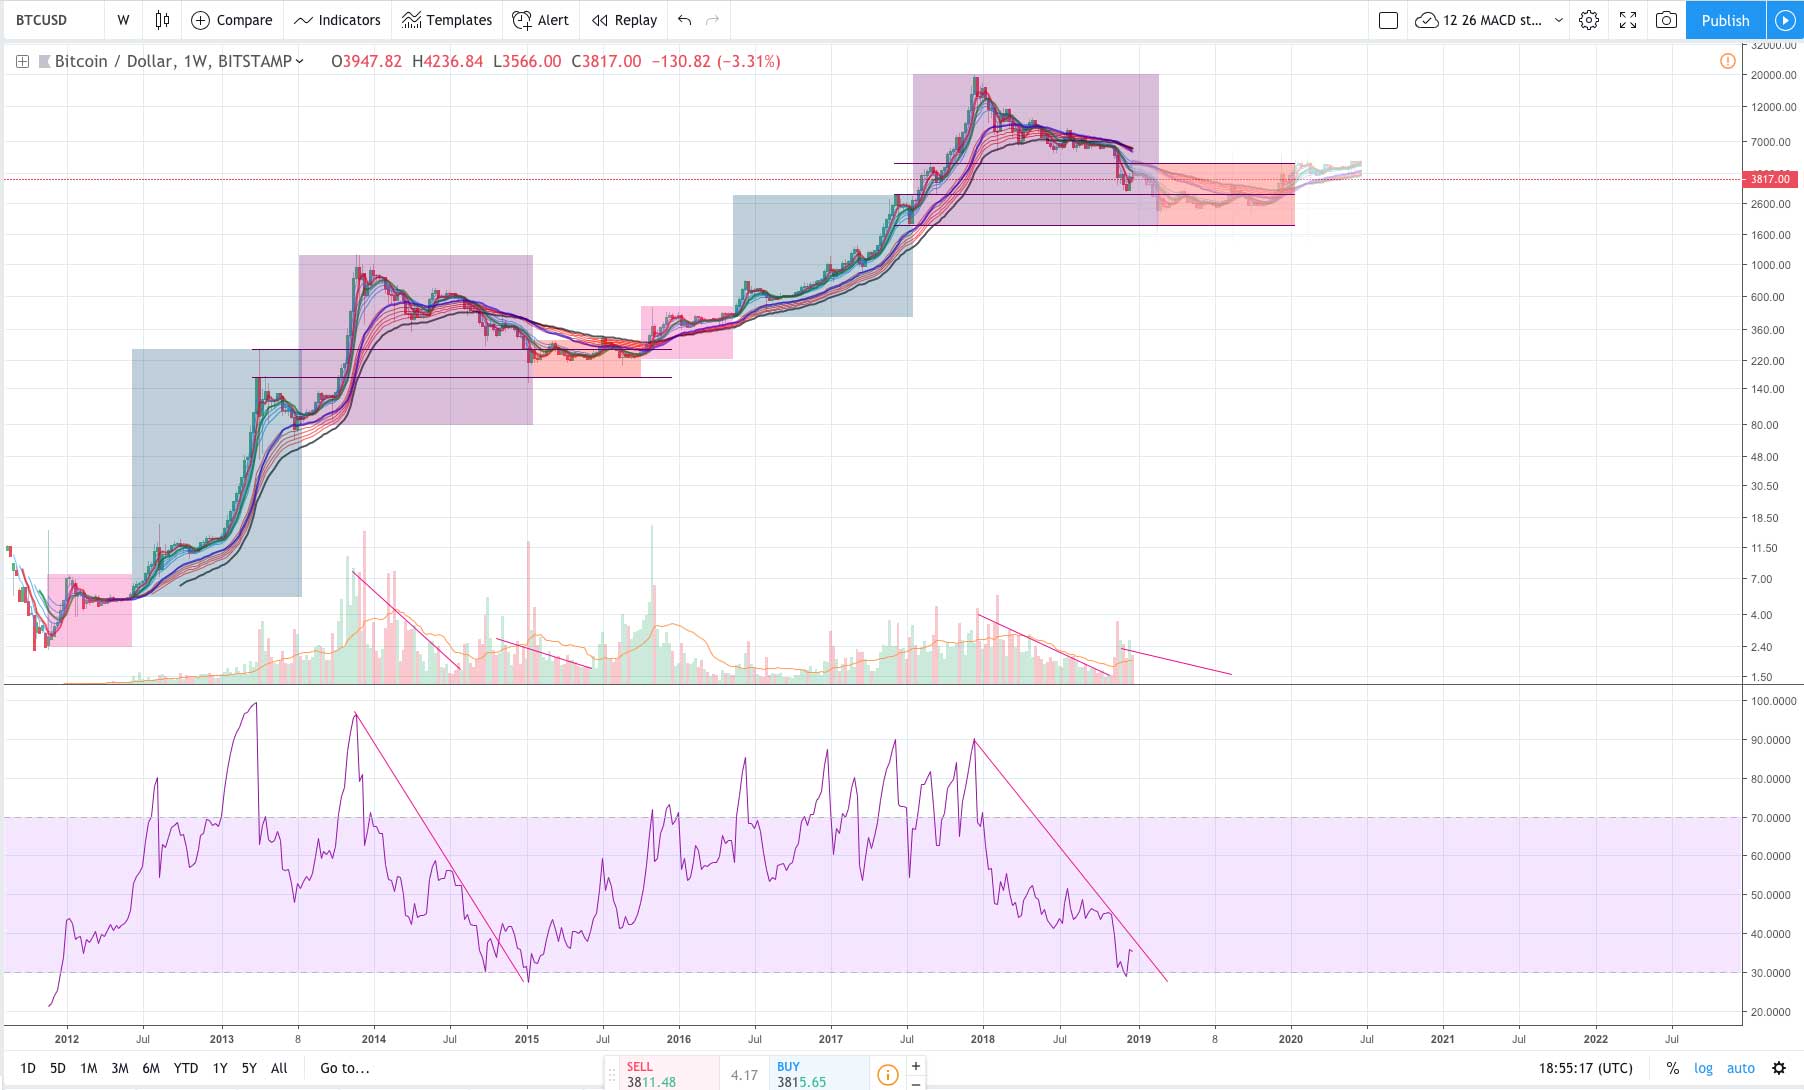
BTC 2016 – 2018 was in many ways a fractal of BTC 2012 – 2014. Will the pattern keep playing out, or is something going to change?
Traders who have been studying charts long enough tend to learn TA. All good analysts should see the roughly same patterns. You can learn a lot from other people, but you can get rekt following someone blindly.
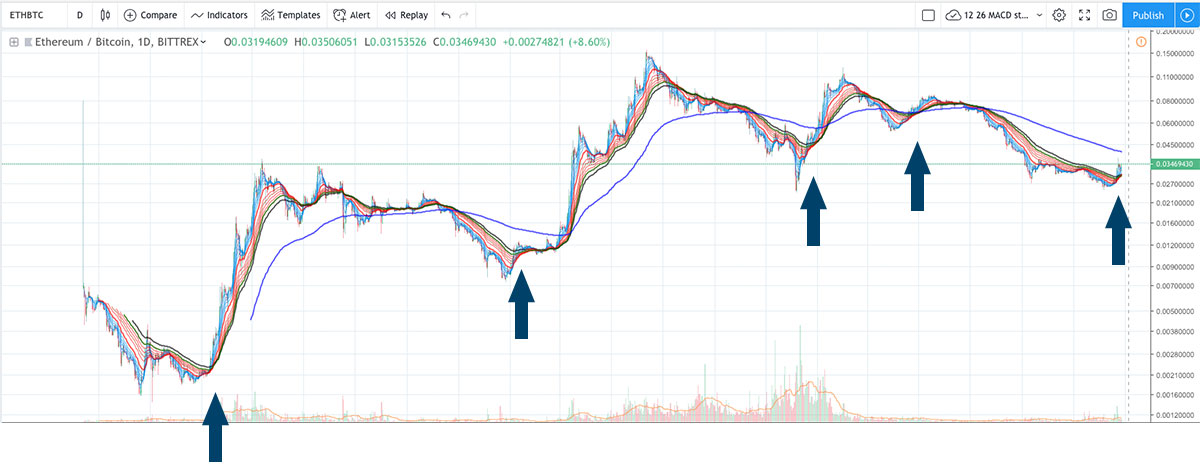
ETH/BTC has a very strong setup in terms of moving averages. If Bitcoin’s inverted head and shoulders plays out, it could send ETH on its way… but, the “crypto 2018 bear market” has rarely allowed such things to occur.
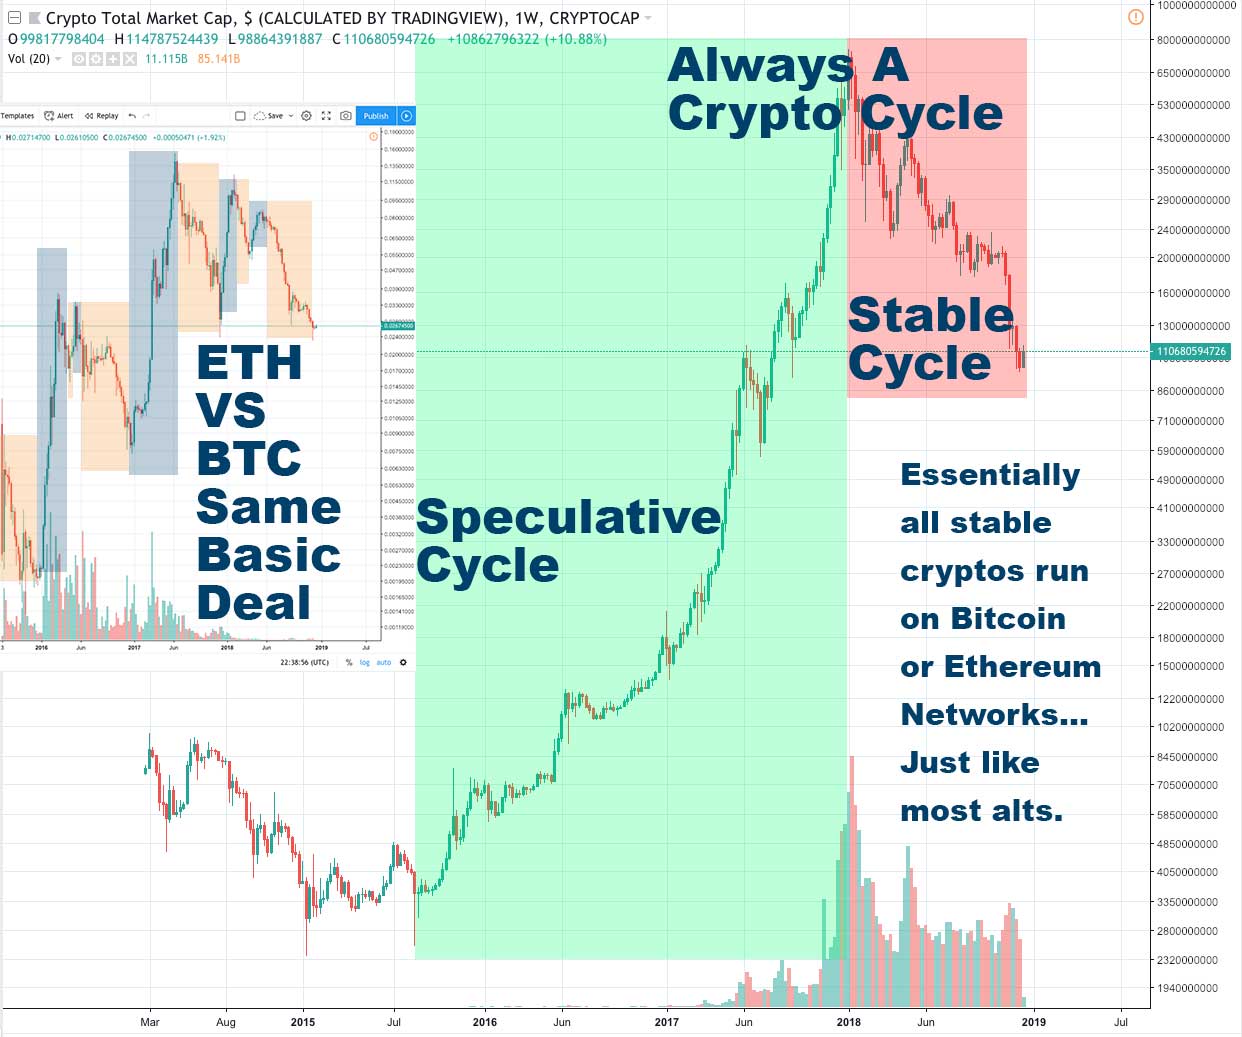
The current crypto market is dominated by BTC and ETH bearishness and stable coin bullishness. When you consider that almost all stables are Bitcoin-based and Ethereum-based, the story gets interesting.
By continuing to use the site, you agree to the use of cookies. more information
The cookie settings on this website are set to "allow cookies" to give you the best browsing experience possible. If you continue to use this website without changing your cookie settings or you click "Accept" below then you are consenting to this.