Looking At BTC Since 2011 in 2019
We look at BTC as a since 2011 here in 2019 to see if I can spot any potential patterns.
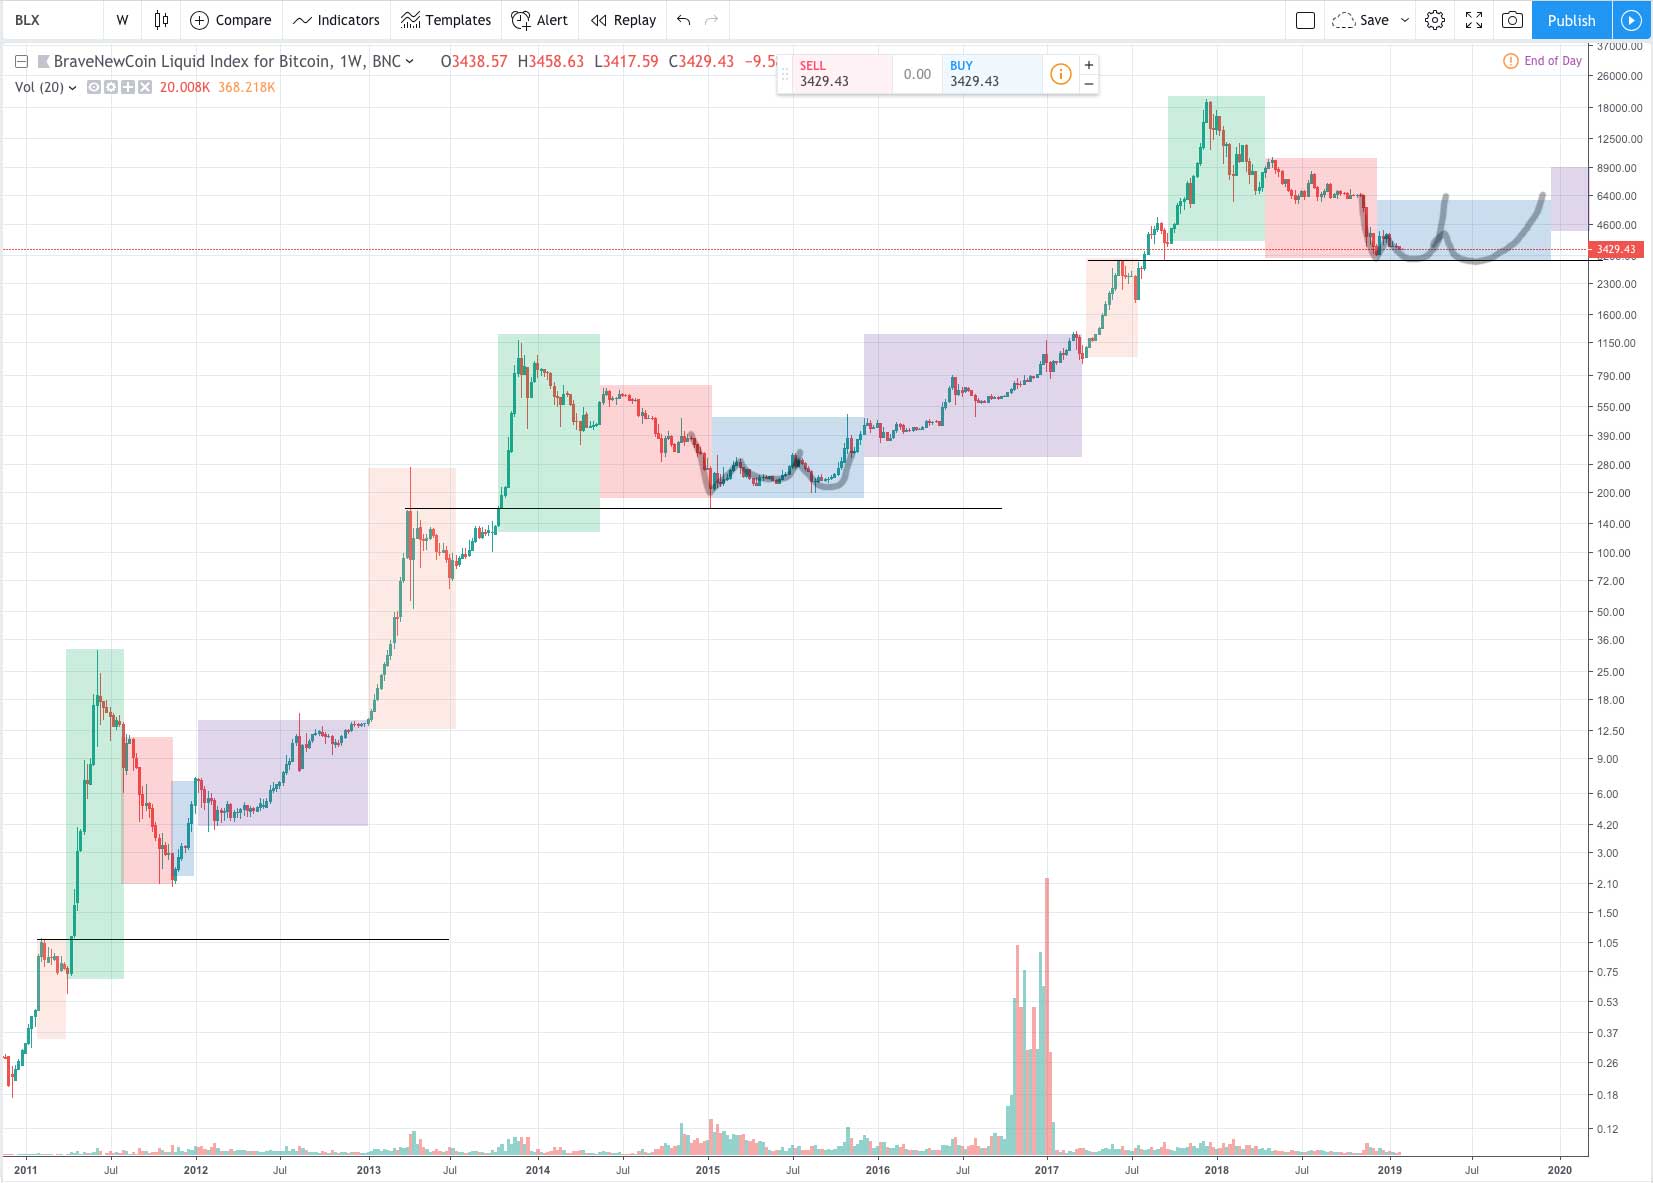
In the above image I’ve color coded parts of 2011 – 2019 that could potentially correlate to each other.
The major take away from this would be that BTC has historically taken back everything made in the green boxes, then bottomed on top of the orange boxes.

If we expect history to repeat in a self similar fashion, then this might imply that we would be looking for a bottom around or just under 3k (meaning we could have potentially already bottomed, or we might see one more dip above or below $3k). <—- this is theory, not fact, and not a prediction, but a philosophical exercise.
This is an alternative theory to a theory that suggests that Bitcoin might bottom at the top of second 2013 rally (about $1,200), because that rally bottomed at the top of the first 2013 rally (about $150).
To better describe my theory, it basically says that the two rallies of 2013 should be considered as part of the same cycle, and that there have actually only been 3 major BTC cycles since 2010 (at least that can be seen on the chart presented above, which is the BraveNewCoin Liquid Index for Bitcoin).
- Cycle 1 takes us from the start of the price action to the bottom of Nov 2011 (to the end of the first red box).
- Cycle 2 takes us from Nov 2011 to Jan 2015 (to the end of the second red box).
- Cycle 3 we are in, it started in Jan 2015 and ends when whenever the bottom of this cycle is in (we are currently in a red box).
This theory also says that while we look to past cycles for patterns, we don’t look to horizontal resistance found in past patterns to find bottoms.
Instead, we look to the part of the current cycle found in the orange boxes.
Here is how to read the chart in general then:
- Blue box is consolidation after the bottom of the last cycle. It is the start of a new cycle… and for anyone previously in crypto, it is also Depression (hence the sad blue color).
- The purple box is the first exciting price action after the initial run out of the blue box. Disbelief.
- The orange box is the first parabolic rally that gets everyone talking about Bitcoin again. Hope and Optimism.
- Then the green box is the second parabolic rally where Bitcoin starts to make headlines. Thrill and Euphoria.
- Lastly, the red box is the cost of that second parabolic rally. After failing to continue the rally, Bitcoin falls into despair and capitulation sets in.
NOTE: To be super clear, this is just one way to look at things. From a simple frame, any place that the price action has consolidated in the past can act as horizontal support all the way down to near zero. The bottom of the range in the last orange box could act as support. The bottom of 2015 could act as support in some pretty nasty possible world. Etc. Literally nothing has to happen and anything could happen. A theory is a model, simply one way to look at things.
NOTE: The first blue box has a V shaped bottom, the second tries to make an Adam and eve, but ends up with an Adam and two eves. This last one, if it is a bottom at all, we might expect to do something similar… and that is what the hand drawn black lines are implying.
NOTE: You know how the line above the first orange box looks very far away from the bottom of the subsequent red box? Well, look to your right, there is only about $1 difference in price. We are looking at a logarithmic scale here!
DISCLAIMER: This is a theory about how patterns might repeat in Bitcoin. This is not meant to be taken as investment advice or price targets. Honestly, it is just an academic and philosophical exercise in “what ifs,” that is very notably an alternative theory to the more popular and likely “we are going to at least $1,200” theory. All that said, if you want investment advice from someone, make sure to find a fiduciary and cut them a check or ask your parents or something 😉
Author: Thomas DeMichele
Thomas DeMichele has been working in the cryptocurrency information space since 2015 when CryptocurrencyFacts.com was created. He has contributed to MakerDAO, Alpha Bot (the number one crypto bot on Discord),...
Thomas DeMichele's Full Bio