Bitcoin is at a Make it or Break it Point
What Could be In Store for 2018 Based off Technicals and History
This is an exciting and scary time in crypto land. Bitcoin, and crypto as a whole, is at a make it or break it point here on June 11th 2018.
NOTE: See charts below and descriptions below for a better understanding of technical terms used on this page… or use Google. Also, standard disclaimer: This content educational at best, is more so entertainment, but is for sure not meant as investing advice.
Looking at the Overarching Bitcoin Chart and Seeing a Bearish Pattern Potentially Repeating
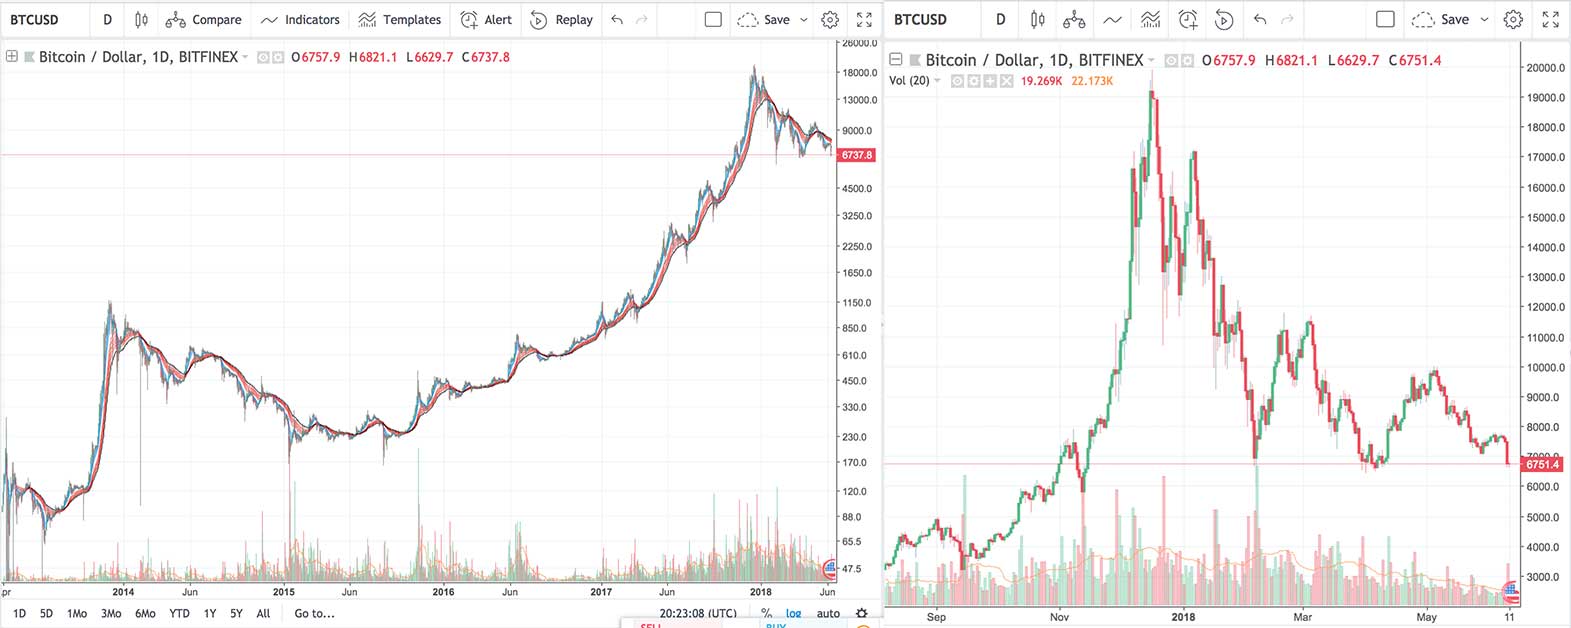
In simple terms, one could make the argument that we are at a place in 2018’s chart that looks a lot like the place where 2014’s rally attempts ended, the triple bottom support was broken, the symmetrical triangle was broken, and a proper bear market set in (i.e. at the equivalent of August – September 2014).

That proper bear market I’m referring to lasted from about August 2014 to October 2015 (a little over 1 year) and saw Bitcoin’s price drop from $400 to $150 at a low (but, since that $150 was very rare, let’s call it $200 as $225 was the more common price in those times).
This means, if we feel that history might repeat (like it has been so far) we could see up to a 50% decrease in Bitcoin and more in alts (potentially much more, like kill your portfolio amounts more with many coins dying off and going to the graveyard).
This would take us, within the next month or so, all the way to about $3k – $4k BTC…. and we would then sit in that range for a while, likely until institutional investors had a custody solution and retail investors had a chance to forget their sadness and become bullish again (6 months to a year let’s say; this is undoubtably will happen, I’m more sure of this than anything else).
That isn’t the worst case of course (the worst case is that things are worse than 2014), but that is a reality we could be looking at if the historic pattern repeats (which, given the lack of fundamentals, speculative nature of the crypto market, and history thus far… we have to be ready for).
Considering Bearishness on Shorter Timeframes
Not only is the overarching pattern suggesting this, but the shorter term pattern is suggesting this to some degree as well.
Essentially Bitcoin had been trading in a ever tightening “symmetrical triangle.” It was, in simple terms, expected to break up or down about where it broke down with more than a little help from the bears. That breakdown could signal the start of a bearish trend.
So, we have a lot of technical factors hinting that we could be in for an all out blood bath and then a long period of stagnation.
Considering Bullish Cases
With the above said, we also have technical factors suggesting more bullish cases.
First off, in terms of the long view, one could make the argument that we aren’t in that August 2014 equivalent spot and instead the little tax day rally of 2014 and the big tax day rally of 2018 should be compared. If this is the case then the next move could be a giant leap back up to $11k and potentially beyond!
On another note, this time focused on the shorter term, daily RSI hit oversold right when we dropped to $6,750. This is the second time it hit oversold on the daily this correction. Every other time the RSI has hit this level since 2017 it has rallied, the only instance of it not rallying would be this one if it doesn’t happen!
Meanwhile the 4hr RSI is even more oversold than that! In fact, 4hr RSI is so low it could single handedly be holding up the market… as it is lower than it has almost ever been (we don’t always see a rally after the 4hr hits oversold, but it is still notable).
These RSI indicators tend to not stay oversold long historically speaking, and thus a big drop right now seems unlikely. We could go sideways for a week or so and then down, but more dropping right now would break many patterns in crypto.
Meanwhile, the above is happening right in a spot where we have about $1k window ($6.75k – $5.75k) that we could call “a triple bottom” (as the price already hit this level twice since the $20k).
It is hard to look at the oversold RSI and potential triple bottom and not factor that into the odds that we might see a rally.
However, back to 2014, this was all essentially true back then and it went sideways to let the RSI recover and then broke down anyway. So… there is that.
Just check out the chart below and see how the daily RSI was oversold in August 2014 after touching oversold once a week or two before… that is literally what is happening today… Y-to-the-MF-IKES, not cool!
NOTE: We could be at other places on the 2014 chart, some way more attractive than others. See some other theories on comparing 2014 to 2018. If you believe in crypto and you are not positioned like crypto could rally here, in my mind you are doing yourself a disservice. We have come this far, it is not the time for giving up in my opinion. But you are your own person, most of all you need to make a choice that you’ll be comfortable with if we go to $1k or back to $10k. For me, both are realistically on the table (despite 2014 hinting at $3k – $4k).

But all this was true in 2014 and 2014 happened anyway.
Looking at the Bands
Further, to add another complexity, I would look at the very relevant Bollinger Bands on the daily candles both here in 2018 and back in 2014 (compare the 2014 chart above to the chart below).
There has been a pretty constant pattern since the $20k top here in 2018 for how Bitcoin bounces off the top, side, middle, and bottom of the bands. If the Feb – April pattern repeats here, we should be right at the bottom of this structure in this price range (thus making this a triple bottom, thus potentially making this the bottom).

Bands say rally is likely.
The Next Move is Likely Sideways
The problem across the board in all these analyses is the same. The next move is likely sideways for a bit with bulls and bears battling over Bitcoin’s RSI (potentially while alts rise and fall). Then, the next move after that is likely to set the stage for the months to come. In this time of sideways motion I’m describing, there is a ton of precedent for one failed rally and for flopping around between $6k and $7k, so expect that and ignore it. It won’t be what we are looking for. What we are looking for is this $1k range of $6k – $7k-ish to break up or down after a bunch of push and pull and fireworks.
If we see alts start to rally in this time, that will be an excellent sign. If we see alts start to die, that will be a giant red flag. If we see a flat market and low trade volume that won’t be ideal, if we see constant price movement and a struggle, that will be a good sign. If we see those buy walls stay up, as miners and big players defend $6k this will be very good, if we see capitulation, it won’t be a great look.
Conclusion
I am not an expert at TA, but I have eyes and have spent enough time watching the markets and listening to people smarter than me to know that this is make it or break it. Meanwhile, I have enough experience to know that key indicators like moving averages, RSI, and the Bands matter and carry a lot of weight in crypto. Lastly, although it only takes eyes to see the patterns I described above, I also know enough about crypto to know it loves patterns.
The bottom line here is that the big pump-n-mania of late 2017 paired with futures trading had a drastic effect on the market, it was an effect we have only seen once in recent history, way back in 2013 – 2014. With the whales of today being many of those who lived through that time, and with algos programmed, it is hard to think we will avoid a 2014-like event. However, if someone as dull as me can see that train coming, part of me does really wonder if we might not see the expected and instead might see an earnest rally attempt and maybe even a bull market from here?
Since there is no way to now without being a big player in the right circle or having a crystal ball, one can only position themselves and place bets.
The only thing I’d say to that is this, make sure you have the funds to buy whatever potential bottom the market decides to take us to. There will be nothing more satisfying than placing big market orders at the bottom (whenever that is) and forcing the bears to give you rock bottom prices. When enough people do that, it will be the very organic and true bottom. Enjoy and try not to lose your shirt, it could get dark for a bit here. 🙂
NOTE: In general, after some sideways action due to the low RSI, I am looking for 1. a rally to $10k – $12k (if we compare tax rally 2014 to tax rally 2018) but then more downside. 2. a crypto to enter a nasty correction like it did in 2014 (in a correction like that $1k, $2k, $3k, $4k, and $5k are all on the table for me). OR 3. this to be a bottom and for the symmetrical triangle and triple bottom to break up potentially just starting a new bull trend. I wouldn’t place odds on any specific case, instead I’m preparing for all of them and keeping my options open.
Author: Thomas DeMichele
Thomas DeMichele has been working in the cryptocurrency information space since 2015 when CryptocurrencyFacts.com was created. He has contributed to MakerDAO, Alpha Bot (the number one crypto bot on Discord),...
Thomas DeMichele's Full Bio