Bitcoin Soon to Form a Golden Cross
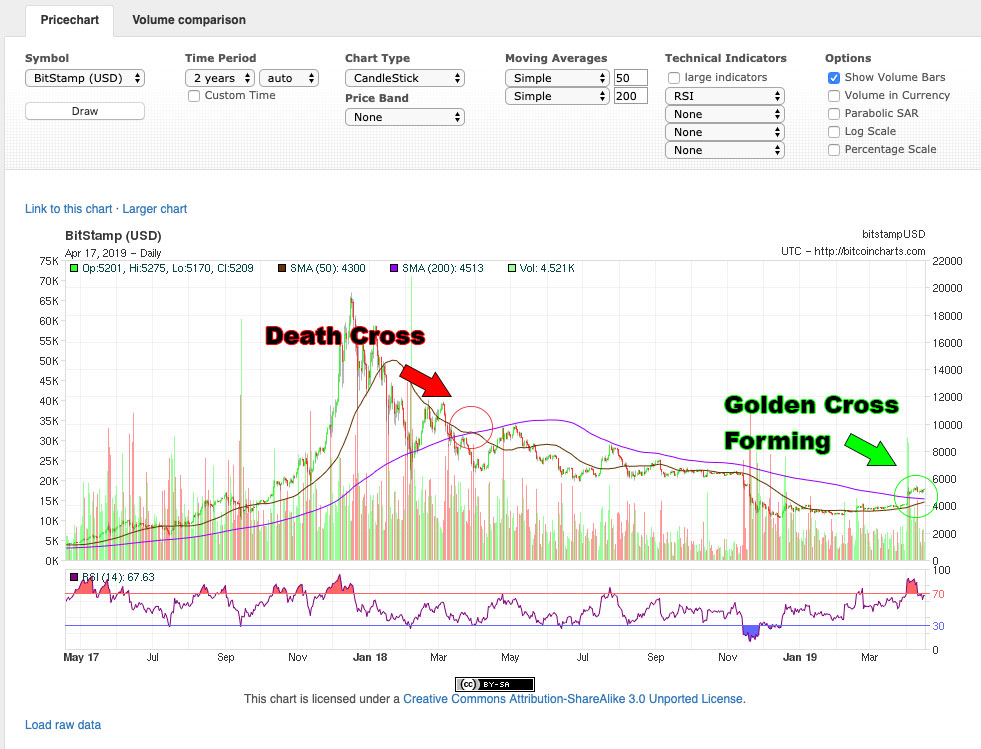
Bitcoin is about to form a Golden Cross as its 50 day Simple Moving Average is set to cross over its 200 day SMA. This pattern does not have to occur, but if it does it would be bullish… that said, to understand how bullish, you have to understand a few other points.
So, here are some points to help you understand:
- You can learn all about the basics of golden crosses here (the page is similar to this, they were written together… this focuses on the now, that focuses on the general).
- The gist is you want to see the faster moving 50 day [Simple] Moving Average cross over the 200. The crossing is called a “golden cross.”
- The golden cross is a bullish sign, it tells us the long term downtrend that brought the 50 day under the 200 in the first place is reversing.
- On the flip side of this, when the 50 crosses under the 200, it is called a “death cross.”
- In terms of Simple Moving Averages, we only saw one death cross the entire 2018 bear market (you can see it on the above chart). That death crosses was an effective foreshadowing of the downtrend (it was hardly smooth sailing or all red days from there, but the trend was however clearly down overall). That said, in terms of Exponential Moving Averages (those weighted toward the most recent price action), we saw multiple attempts before the trend took place.
- The last four “EMA” death crosses on Bitcoin were August 2014, August 2015, March 2018, and May 2018.
- The last three “EMA” golden crosses on Bitcoin were July 2015, Oct 2015, and May 2018.
- The EMAs crosses tell a story that is important to keep in mind when thinking about crosses in general (I’m discussing EMAs here to illustrate something that isn’t clear with SMAs on Bitcoin’s chart). The story is that it is common for an initial golden cross or death cross to fail, but for it to signal the start of a new trend anyway. It wasn’t until the second attempt of the 2015 uptrend in terms of the EMAs or the second attempt of the 2018 downtrend in terms of the EMAs that we saw continuation…. and in fact, if you rewind the tape, you see this pattern play out previously as well.
- Given the last point, there are a few things to consider. For example, if we see the EMA cross first, but not the SMA, we might look for a correction before the uptrend starts! In 2015 when the EMA crossed the first time the price then retested the bottom before starting the face-melting uptrend of 2015 to 2017 for example.
- With the last point in mind, betting that history will repeat exactly is a bit of a gamble. Long term investors with a bullish mindset may not want to bank on getting multiple opportunities, conservative investors may want to wait for a more clear sign like the 100 crossing over the 200 (or may simple want to wait for a few candles to form after the cross), and traders may want to themselves play this differently.
- Also, keep in mind, the cross could fail to form, with the forming of the cross acting as resistance for example, and this would be a bearish sign (although like any bearish or bullish sign, just a sign and nothing more).
- All that said, it is hard to stop these slow moving crosses from forming, about the only thing that will stop it is a sharp reversal of the current trend and a strong continuation of the downtrend (to drag the 50 down good and proper).
- In simple terms, there are a lot of conditionals going into this potentially bullish event, but if the cross form it bodes very well!
- There is no perfect way to play crosses, but in the simplest of worlds, being in an asset when the 50 SMA and EMAs are above the 200s and out when they are below is a pretty darn good strategy.
Author: Thomas DeMichele
Thomas DeMichele has been working in the cryptocurrency information space since 2015 when CryptocurrencyFacts.com was created. He has contributed to MakerDAO, Alpha Bot (the number one crypto bot on Discord),...
Thomas DeMichele's Full Bio