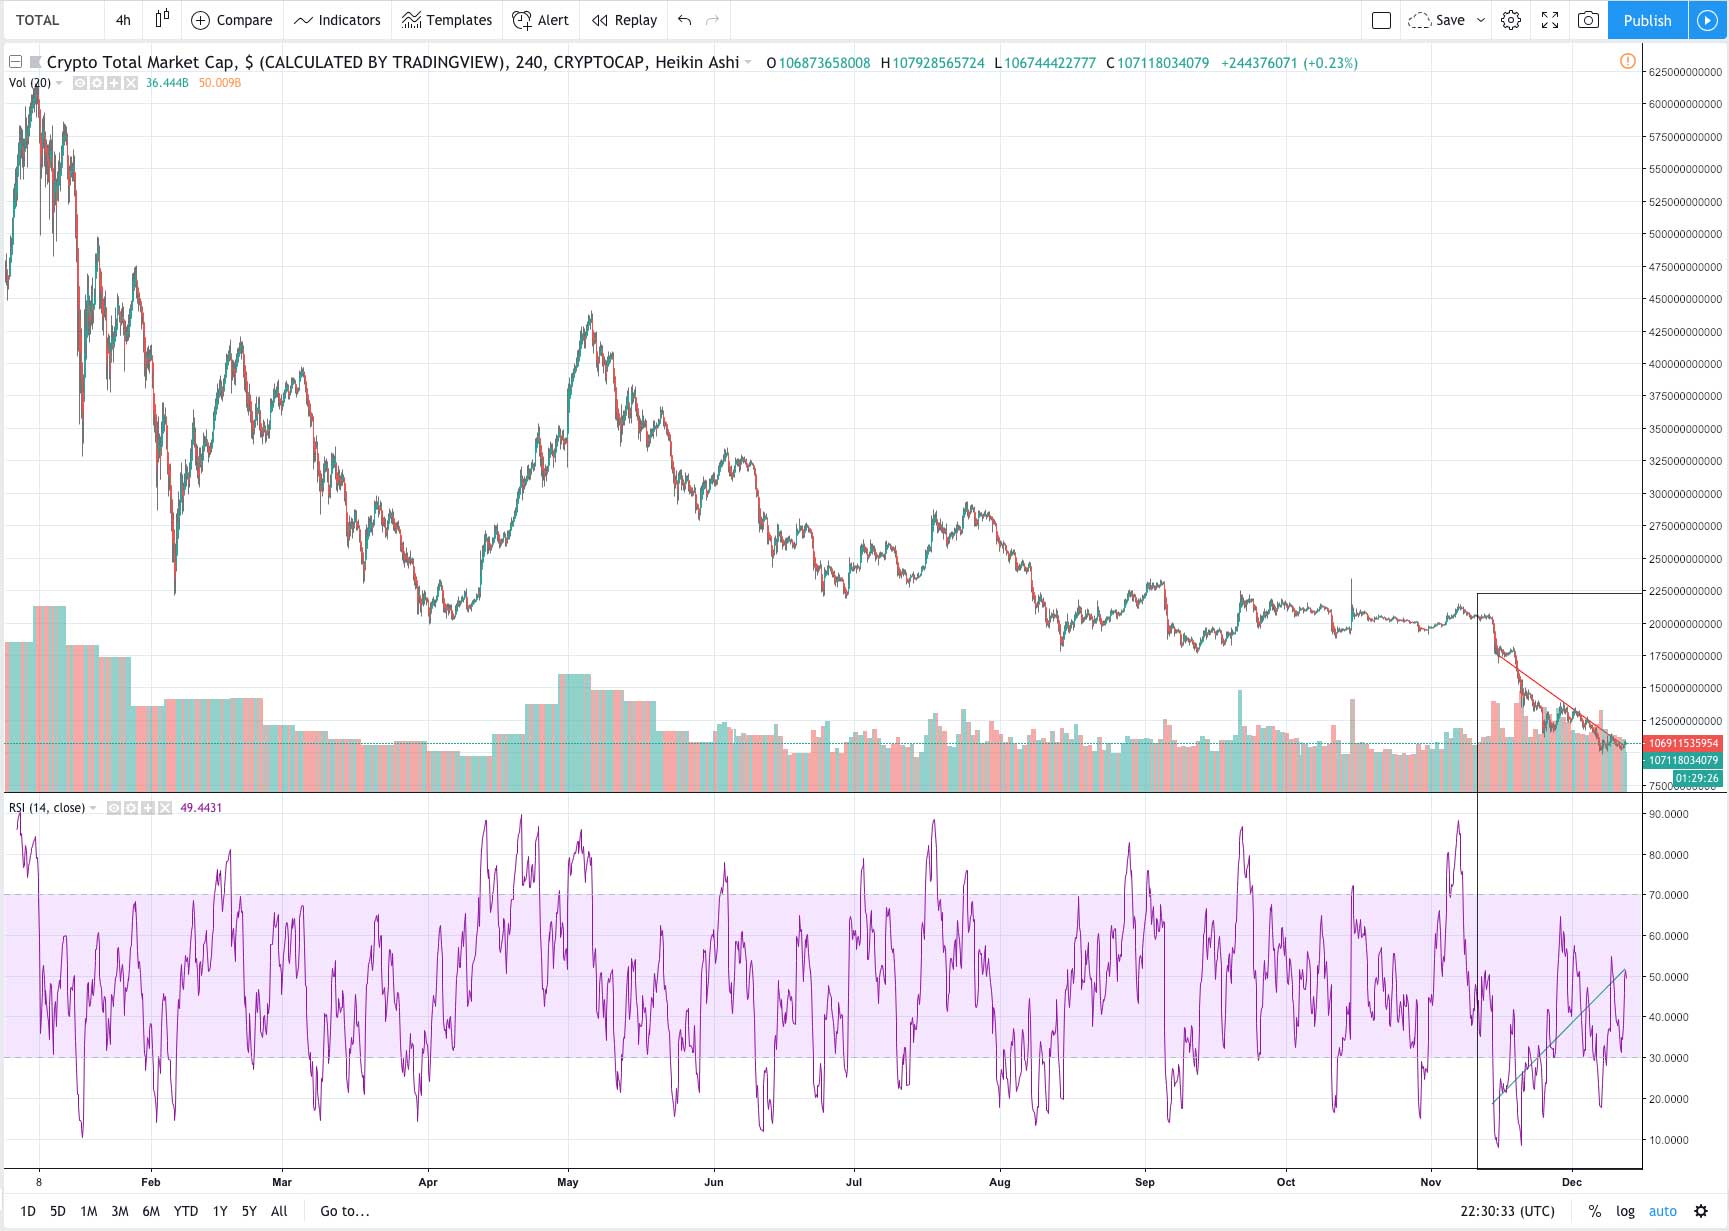
Bullish Divergence on 4hr RSI For BTC and Crypto Cap

There is a bullish divergence on the 4hr RSI for BTC and the crypto market cap as a whole. This is a bullish reversal pattern found at bottoms… but it is also a pattern that appears in the midst of long downtrends.
In words, the pattern is there, and it is a type of bullish reversal pattern, but it has a somewhat low success ratio when found in a steep downtrend. Further, this is a single bullish indicator in another wise brutal bear market.
Thus, while this is interesting to point out for the sake of learning about RSI divergence in analysis, it is probably not worth putting too much faith in.

All that said, it’s worth noting this divergence is also present on the Nasdaq and on different time frames on btc… and on other charts and time frames. Essentially lots of assets sold off over the past month or two have printed this pattern. Take a look for yourself.
For more reading, see: Relative Strength Index (RSI).
Bottomline: We are in a bear market in a downtrend, so a bullish divergence on a 4 hour time frame doesn’t carry much weight. Still, it is there, so why not take this time to learn about RSI divergence.
What is bullish divergence / bearish divergence? RSI divergence is why the price and RSI trend in the opposite direction. When the price goes up, but RSI down, it is bearish divergence. When the price goes down, but the RSI goes up, it is bullish divergence. In both cases it is a trend several pattern that can also appear in the middle of downtrends and uptrends as a continuation pattern (meaning it can be a deceptive pattern). In our current situation the price/market cap is trending down, but the RSI is trending up. That is a “bullish divergence of the price and RSI.” That said, we are also in the middle of a bear market, so “meh.”