Current BTC Price Action Reminiscent of Early 2012 and Mid-to-Late 2015
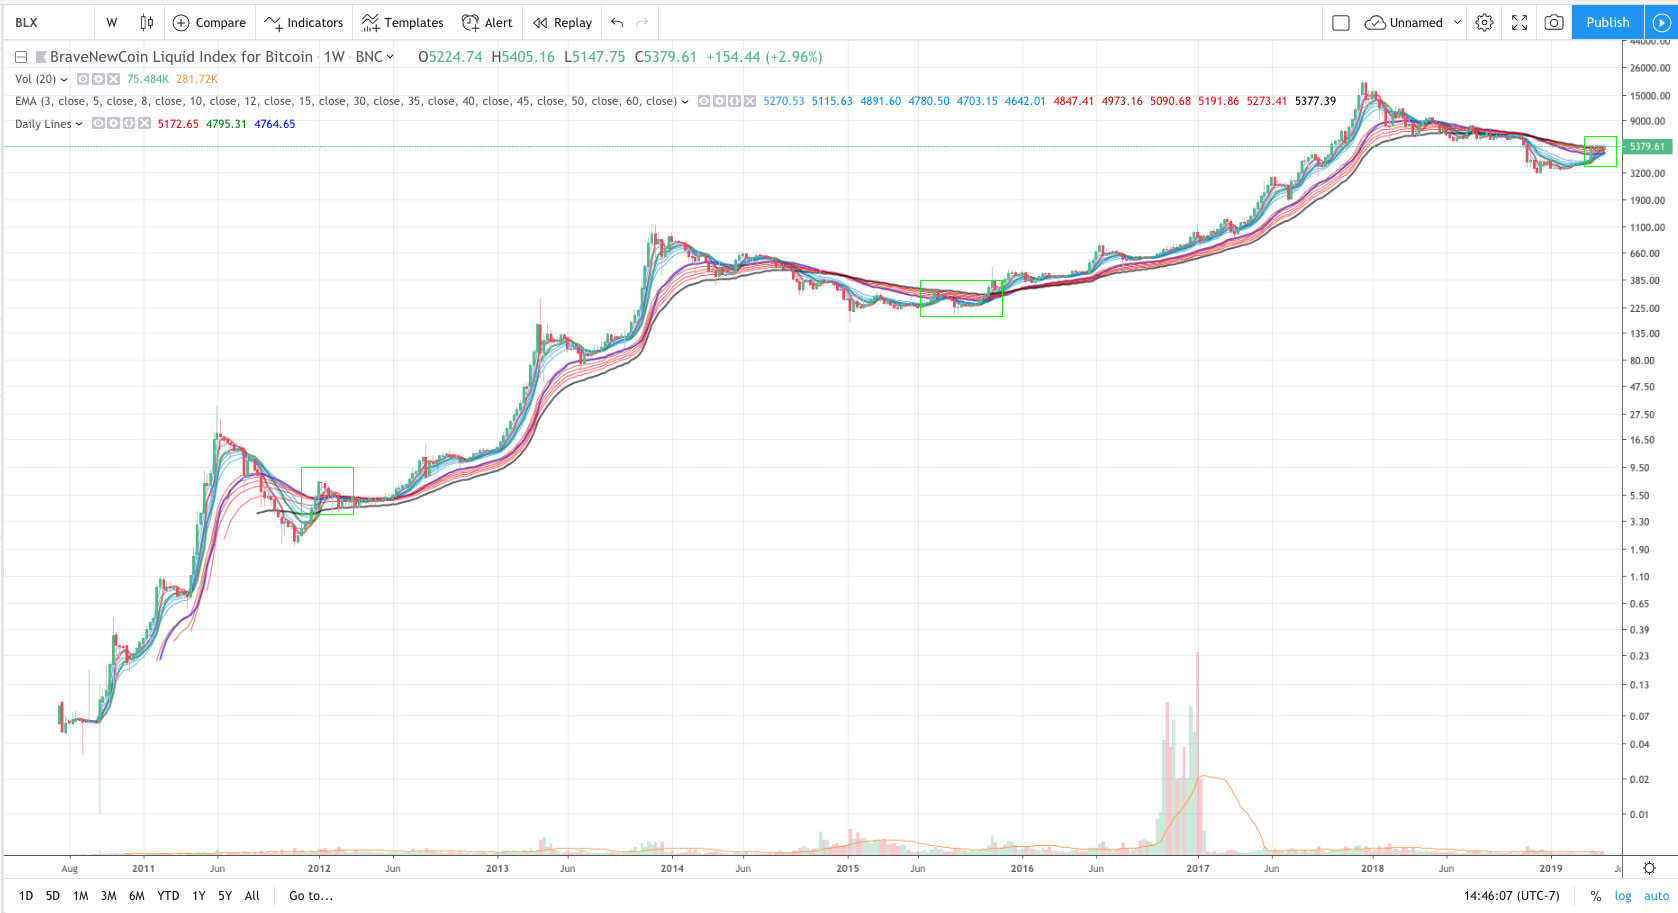
The above chart shows Bitcoin 2010 – May 2019. In my opinion the current price action is similar to 2012 and mid-to-late 2015.
In both of these times Bitcoin had pretty much found its bottom for that part of the cycle and then was in the process of gearing up for its next run.
In 2012 you really couldn’t go wrong buying wherever if you were going to HODL (although sure, $1k does buy more $4.50 BTC than it does $7 BTC, and that does matter over time), in 2015 however there was another re-test of the lows before BTC took off (and of course $1k does buy more $150 BTC than $300 for that long HODL).

So does this thing fractal out and have $5k BTC getting flak from $3k BTC people when we hit $100k? Or is this a head fake before the doors of heck open up? Cool, really wish I knew, I would of course adjust my position accordingly. That said, I think there is enough signs that point at this being toward the start of a new cycle to be at least a little excited about the future again.
Author: Thomas DeMichele
Thomas DeMichele has been working in the cryptocurrency information space since 2015 when CryptocurrencyFacts.com was created. He has contributed to MakerDAO, Alpha Bot (the number one crypto bot on Discord),...
Thomas DeMichele's Full Bio