The GBTC / ETCG Indicator is Mighty Bullish
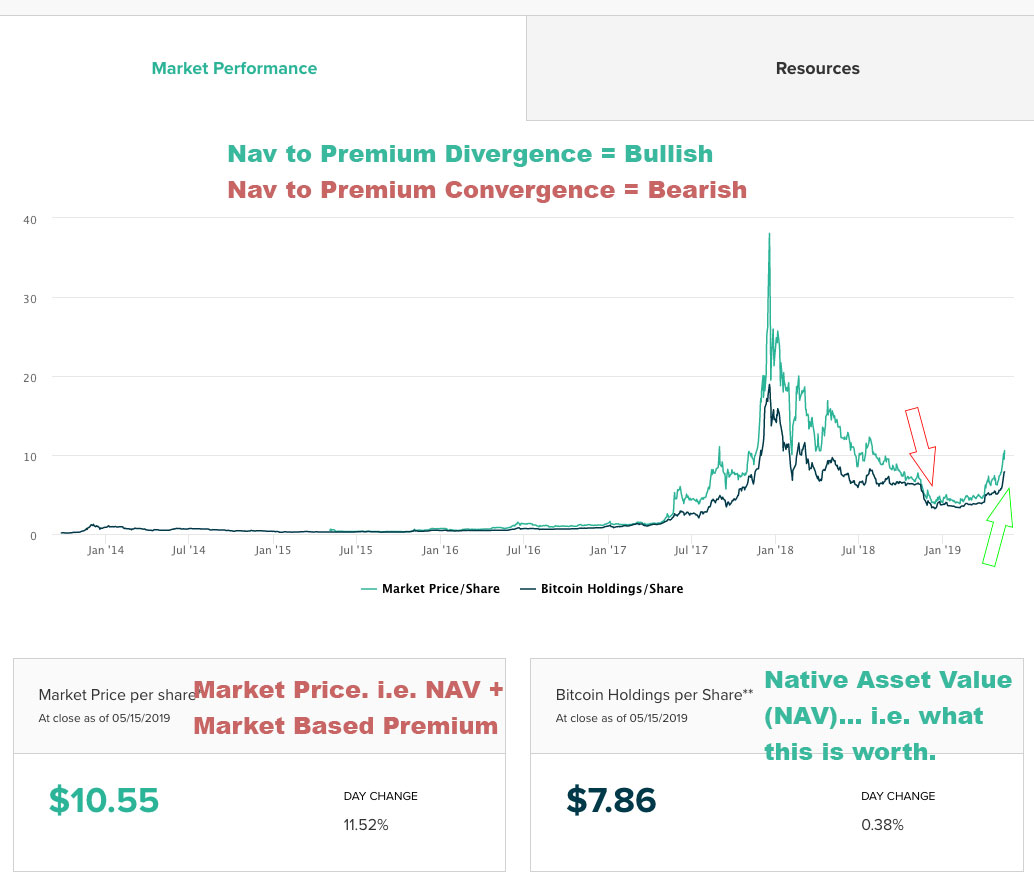
When GBTC and ETCG trade at a premium to the underlying assets, it is generally a sign that crypto is bullish.
A section focused on technical analysis. Any article that looks at charts or talks about how to look at charts can be found here.
Please note we don’t do price targets on this site, we do educational content focused on learning about the basics of technical analysis.
With that in mind you’ll find two types of content here:
Discussions about the fundamentals of the technicals and resources. Things like “what is technical analysis,” “how to use Trading View,” and “how to use moving averages in crypto.”
Educational and informational looks at historic, current, and potential crypto charts (sometimes compared to non-crypto charts). So things like “a comparison of 2014 and 2018,” or comparing the tech bubble to the crypto bubble,” or “bulls need to ward off this death cross or it won’t be a good look technically speaking; Let’s take a look at what death crosses mean.”
NOTE: This content is meant to be informational and educational; it is not investing advice. That said, here is some free life advice, as a general rule of thumb don’t make important financial decisions based on information you find on the internet… ?

When GBTC and ETCG trade at a premium to the underlying assets, it is generally a sign that crypto is bullish.
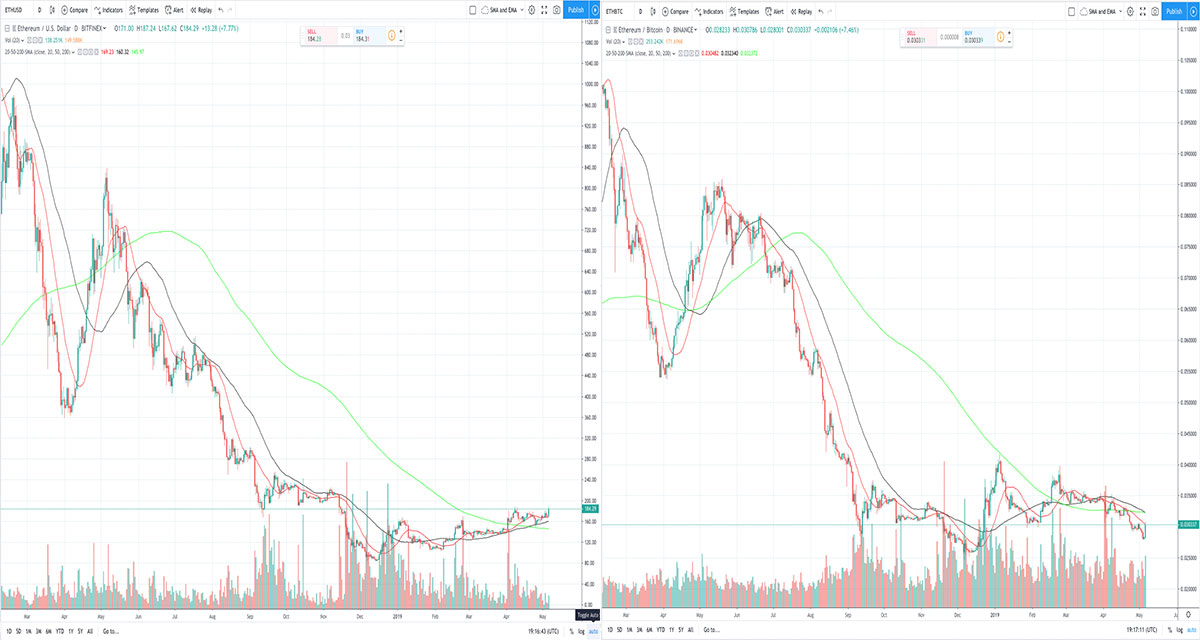
One could argue, based on some factors like Simple moving averages that the BTC-ETH pair is bearish and at the same time the BTC-USD pair is bullish. It is the same for many alts.
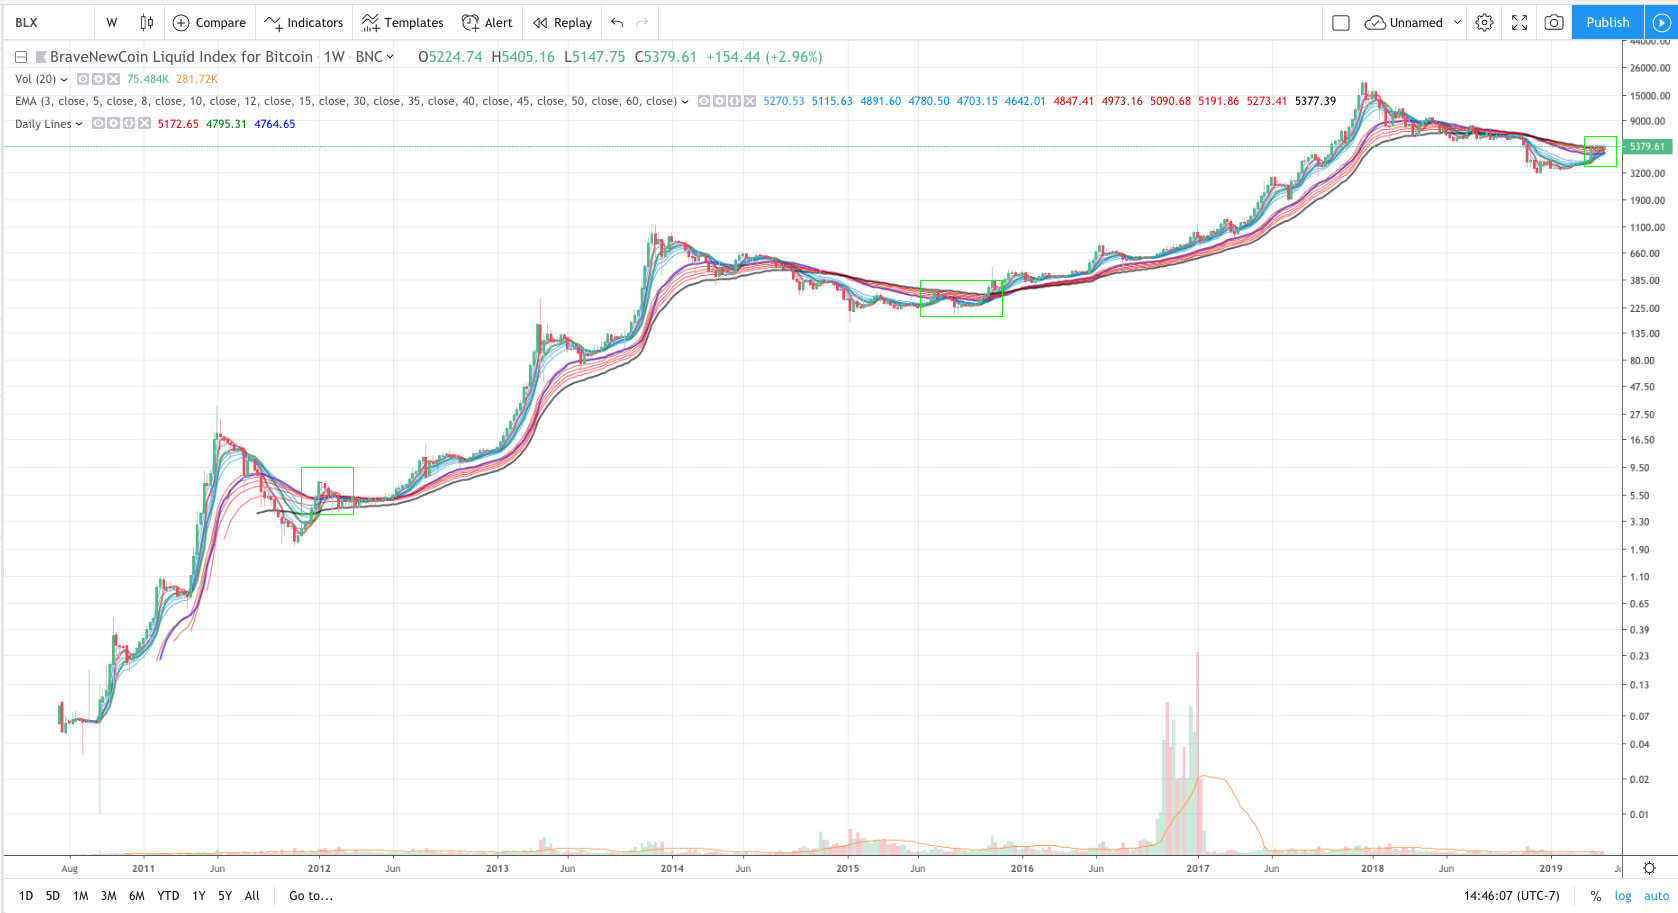
The above chart shows Bitcoin 2010 – May 2019. In my opinion the current price action is similar to 2012 and mid-to-late 2015.
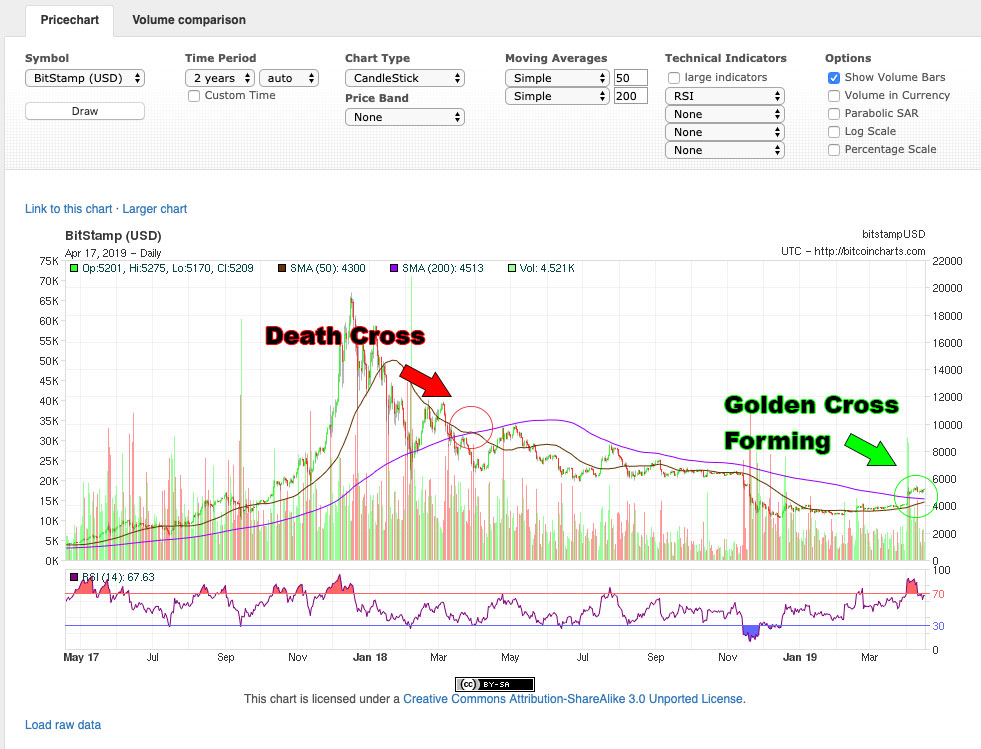
A Golden Cross is when the 50 day Simple Moving Average of an asset crosses over the 200 day SMA. A Death Cross is when the 50 day crosses under the 200.

Bitcoin is about to form a Golden Cross as its 50 day Simple Moving Average is set to cross over its 200 day SMA. This pattern does not have to occur, but if it does it would be bullish.
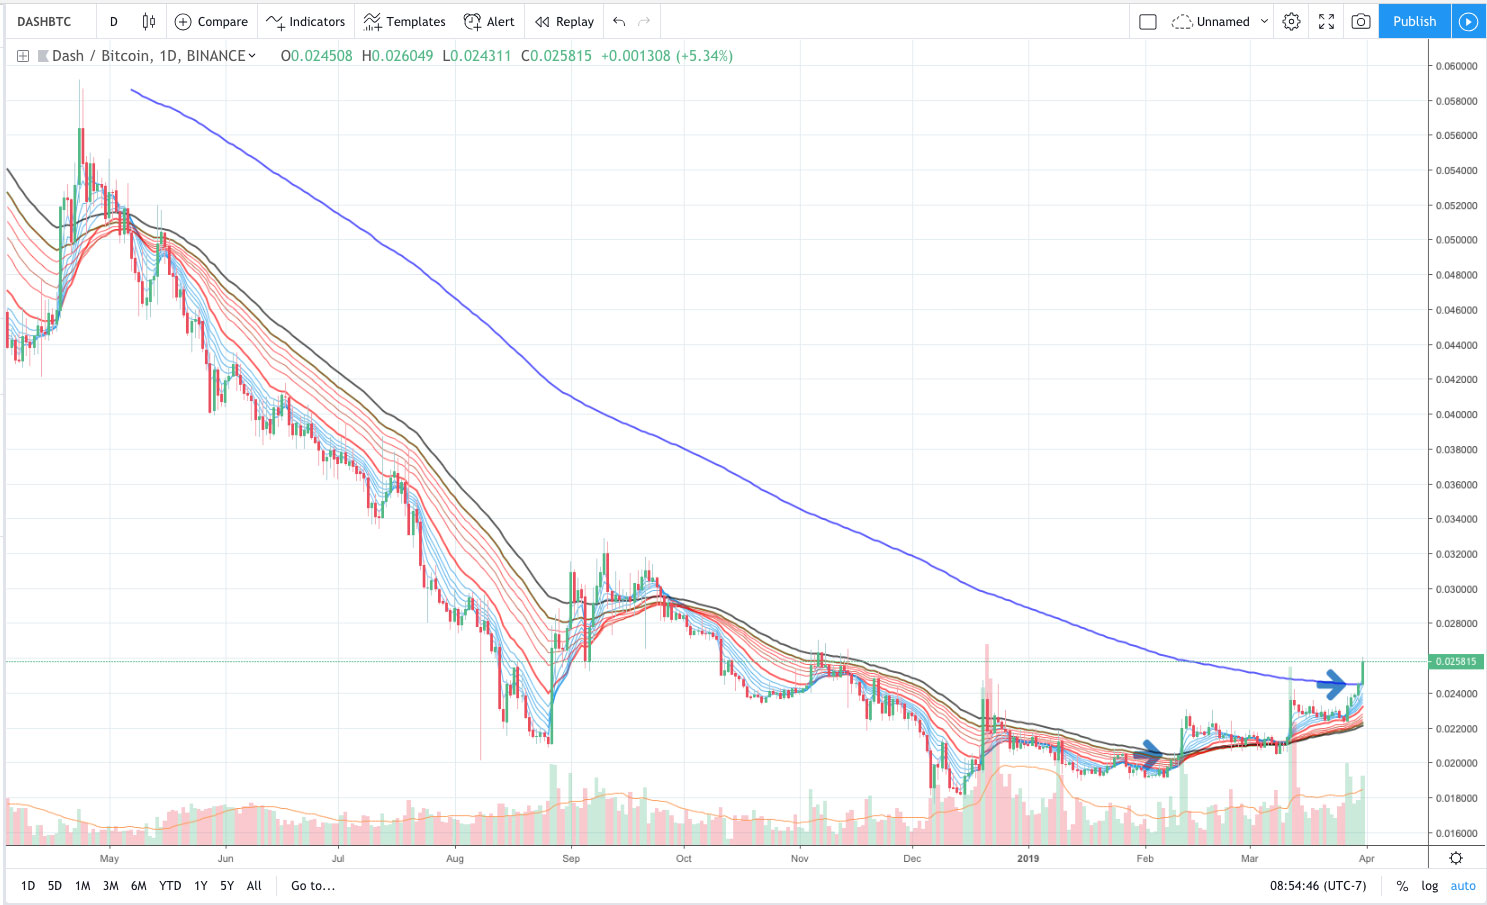
If you want to find great plays during alt season, look for trend reversals and coins still under their 200 day EMA.
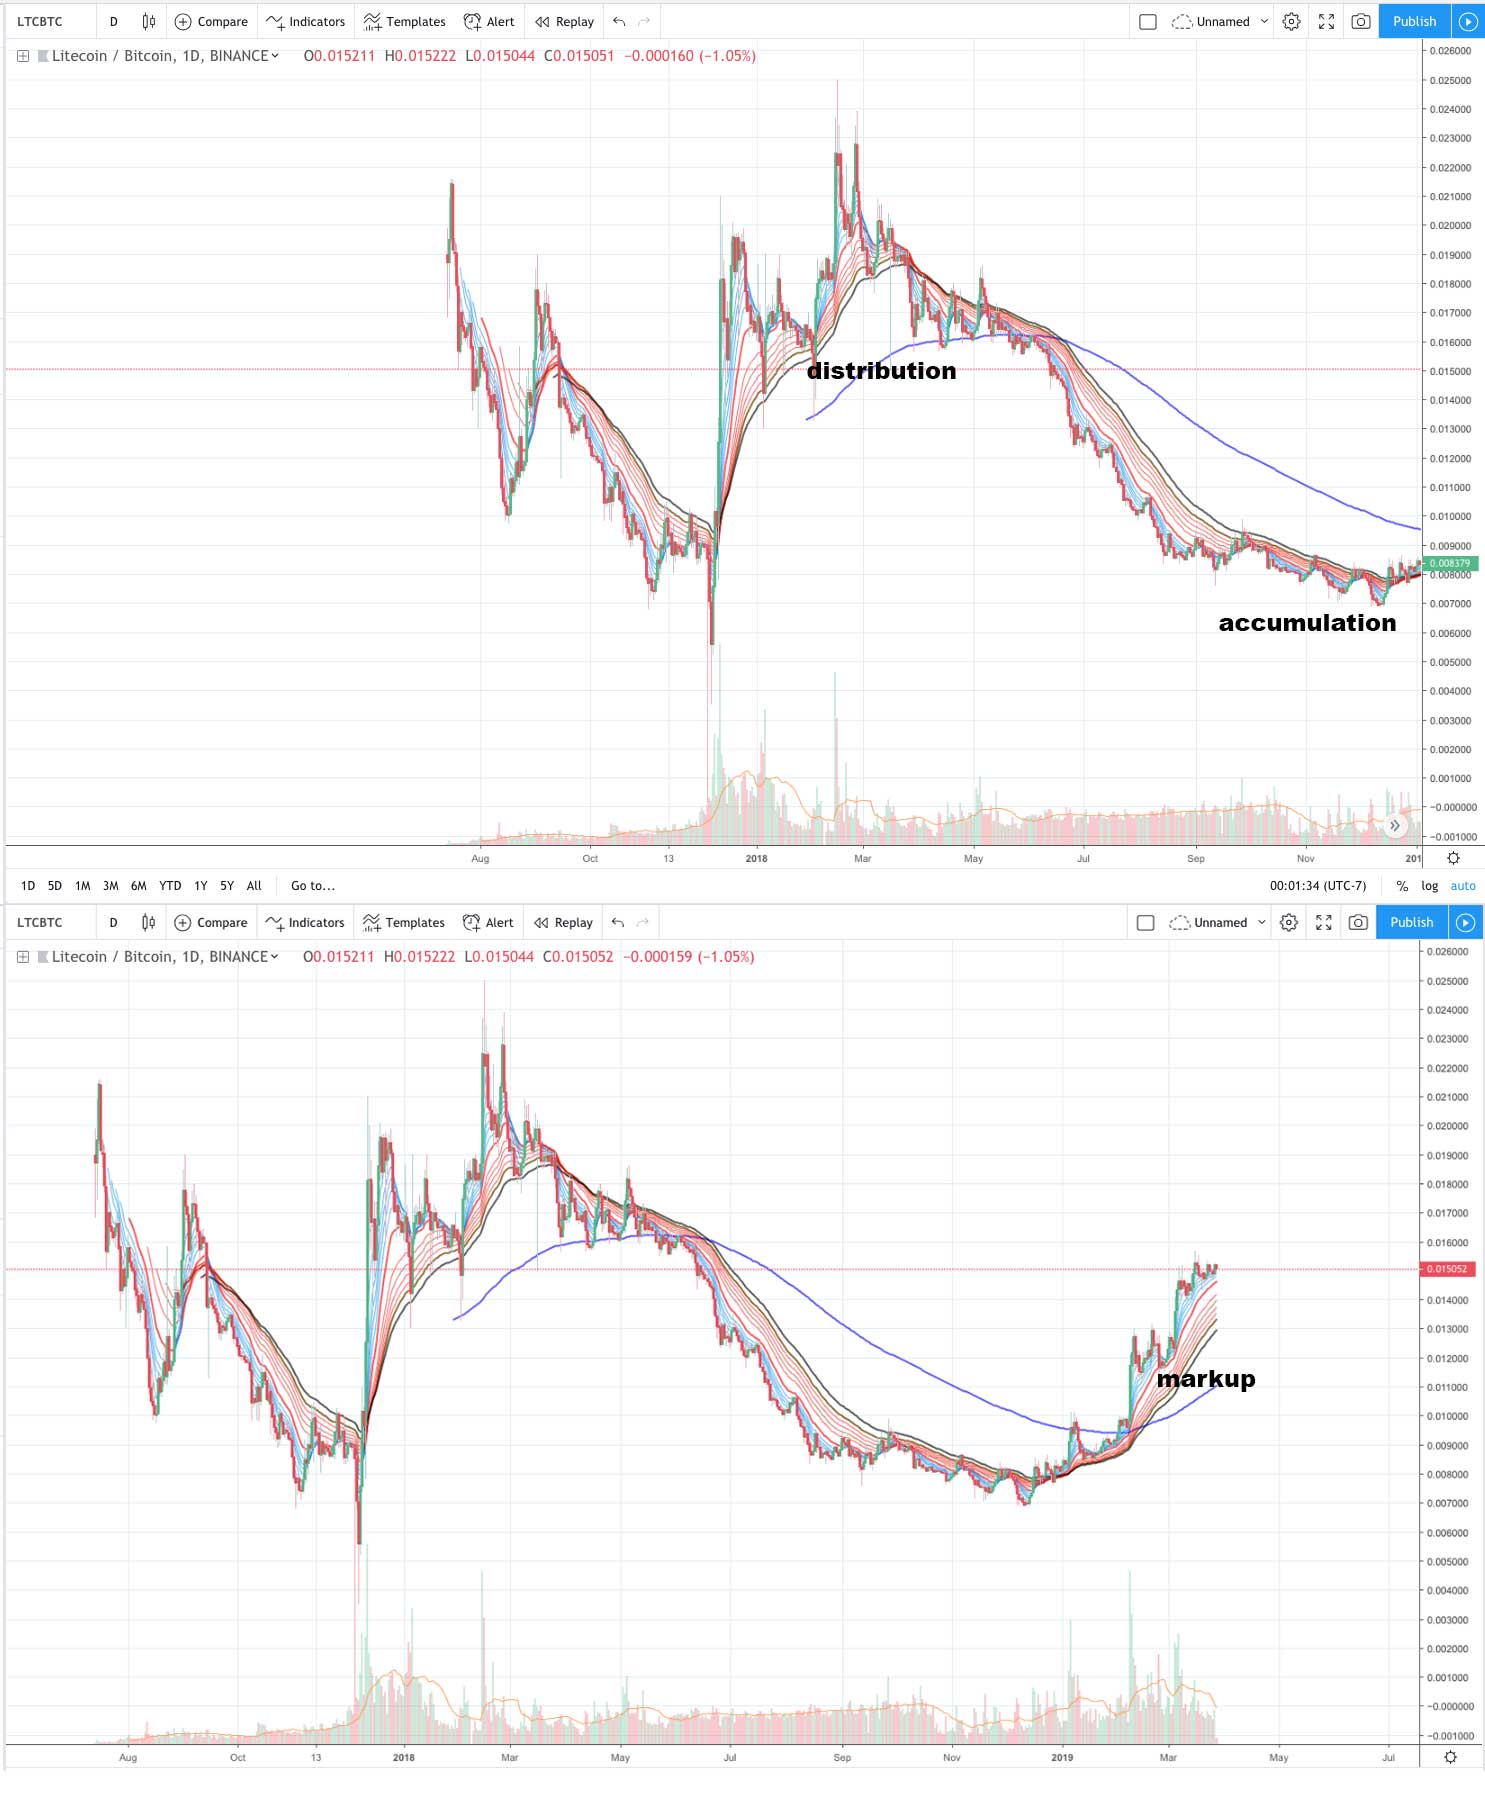
The crypto market has been pretty bullish lately, and looking at charts it is easy to see why.
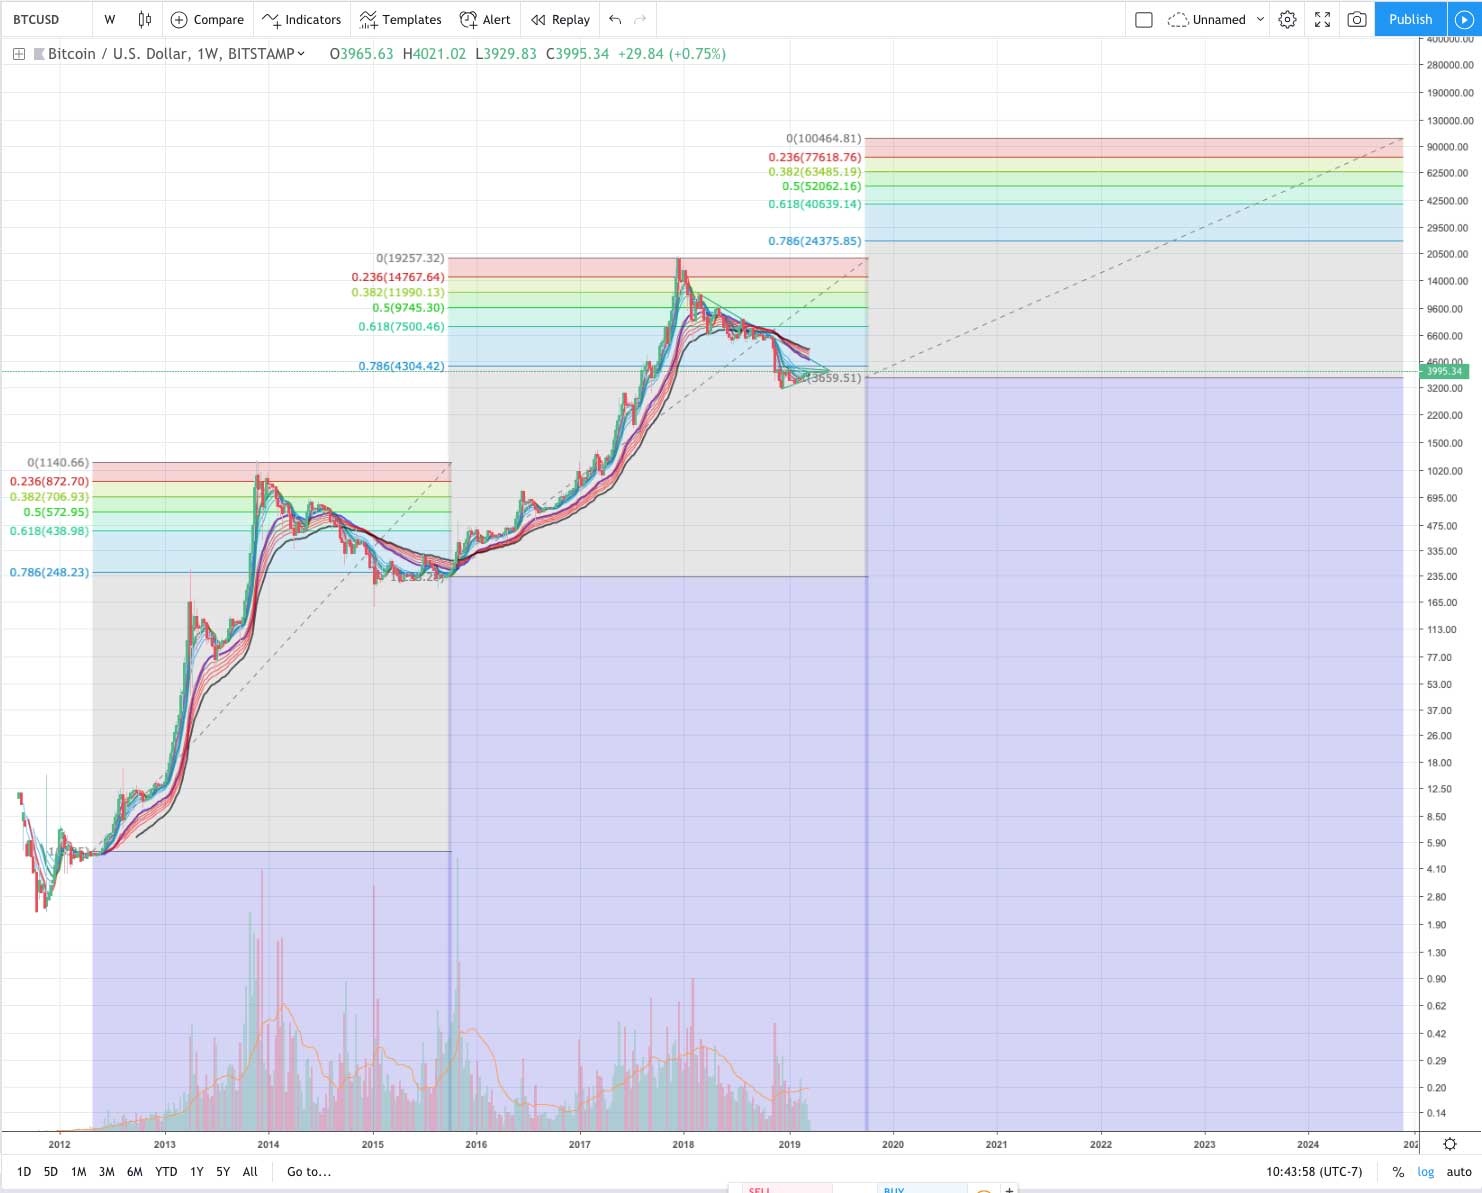
This chart looks at BTC from 2013 – 2019 and beyond using fib levels. You can see the 2013 market cycle looks a lot like the 2017. Does that pattern repeat?
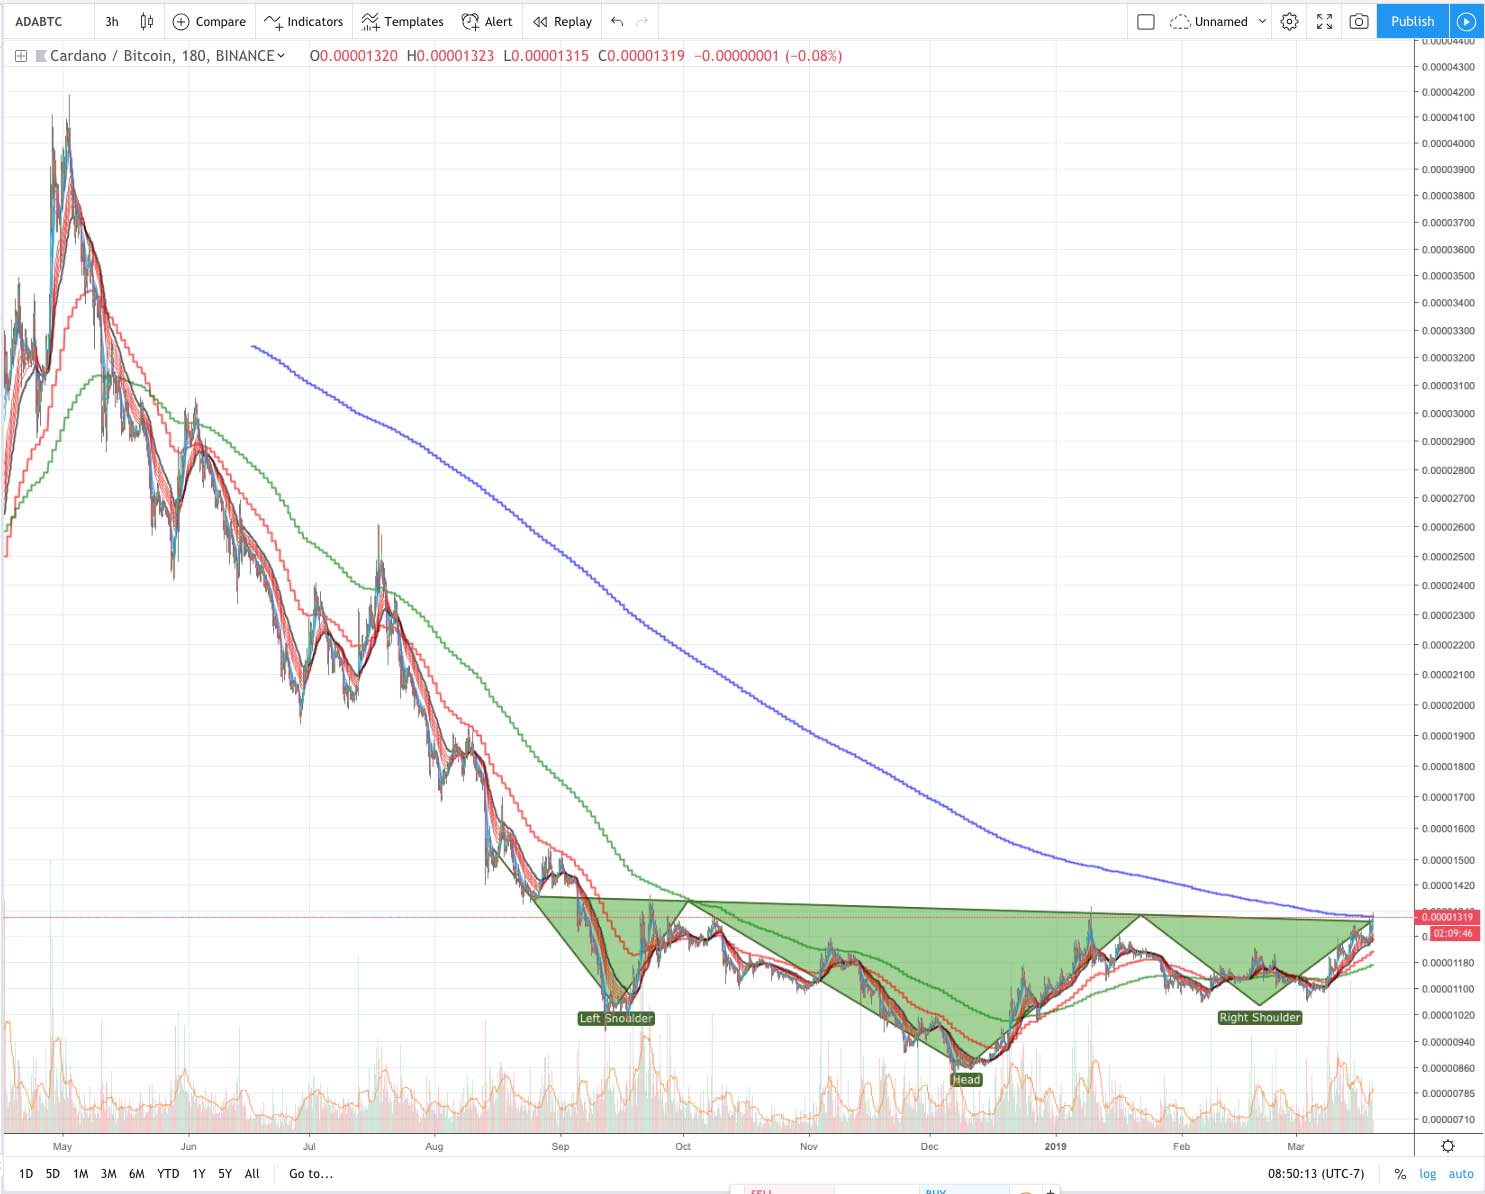
ADA is setup for a breakout with it forming a potential inverted head and shoulders bottom right below the 200 day ema.
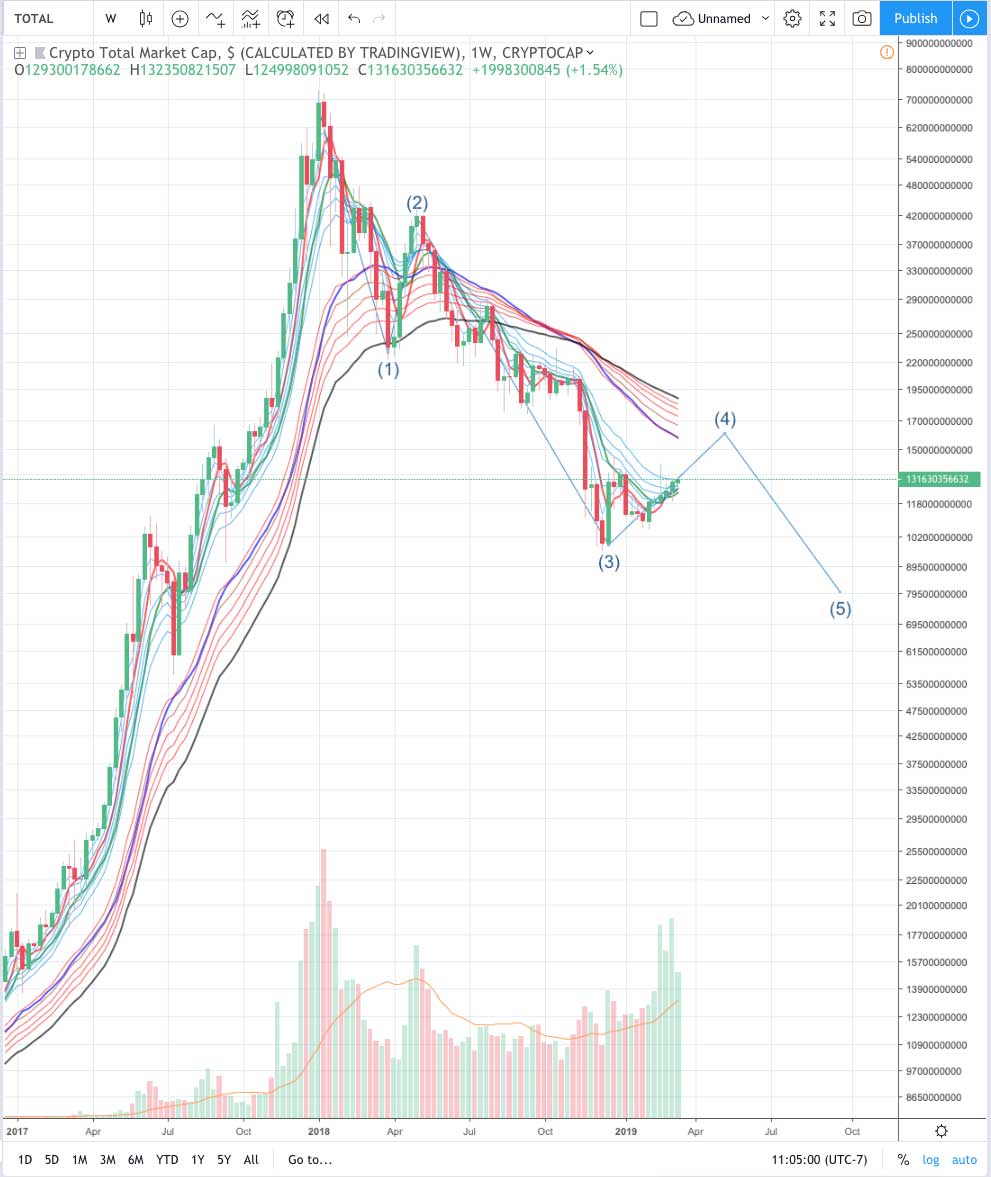
Here is a look at what the 2018 – 2019 bear market could look like in terms of Elliot Waves. This rough sketch implies we are on a corrective 4th wave before the final 5th wave down.
By continuing to use the site, you agree to the use of cookies. more information
The cookie settings on this website are set to "allow cookies" to give you the best browsing experience possible. If you continue to use this website without changing your cookie settings or you click "Accept" below then you are consenting to this.