Bitcoin, Ethereum, and the Stable Coin Cycle
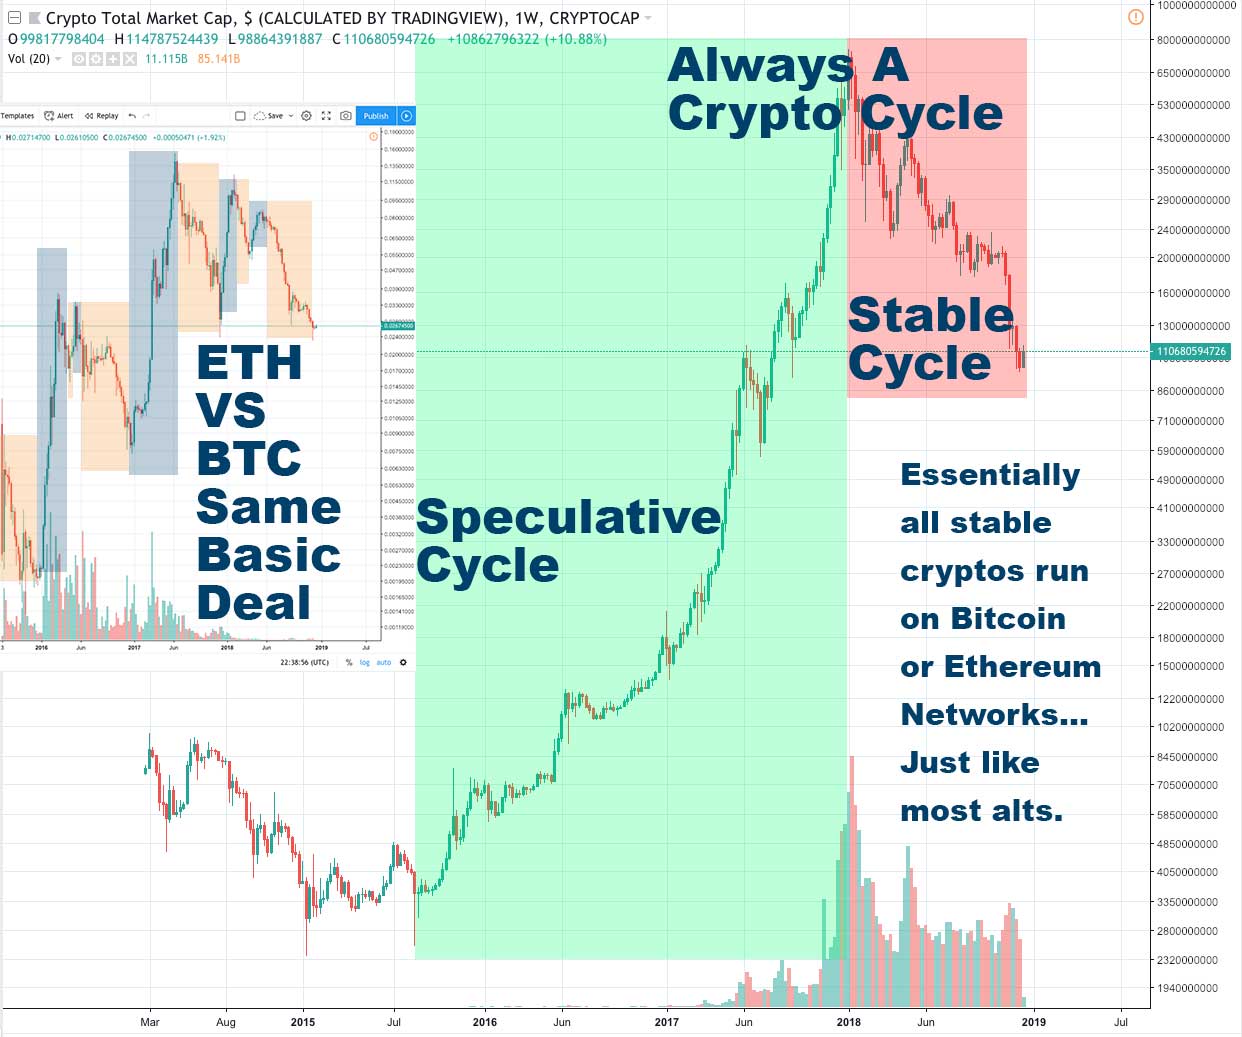
The current crypto market is dominated by BTC and ETH bearishness and stable coin bullishness. When you consider that almost all stables are Bitcoin-based and Ethereum-based, the story gets interesting.
Cryptocurrency opinions, op-eds, speculation, and insights. Oh, my!

The current crypto market is dominated by BTC and ETH bearishness and stable coin bullishness. When you consider that almost all stables are Bitcoin-based and Ethereum-based, the story gets interesting.
In June 2015, when we started this site, one Bitcoin was worth about $225 USD. By comparison the next most valued cryptocurrency at the time, Litecoin, had a value of about $1.50. In that time I offered words of caution.
A while back a TradingView Analyst named gmgame released the most epic crypto TA chart in the history of capital markets “The One Coin to Rule Them All.” This week he followed up with the sequel “The One Coin to Rule Them All – Chapter II.”
Coinbase has reiterated its goal of adding a large range of digital assets, assuming they meet Coinbase standards and are compliant with local laws.
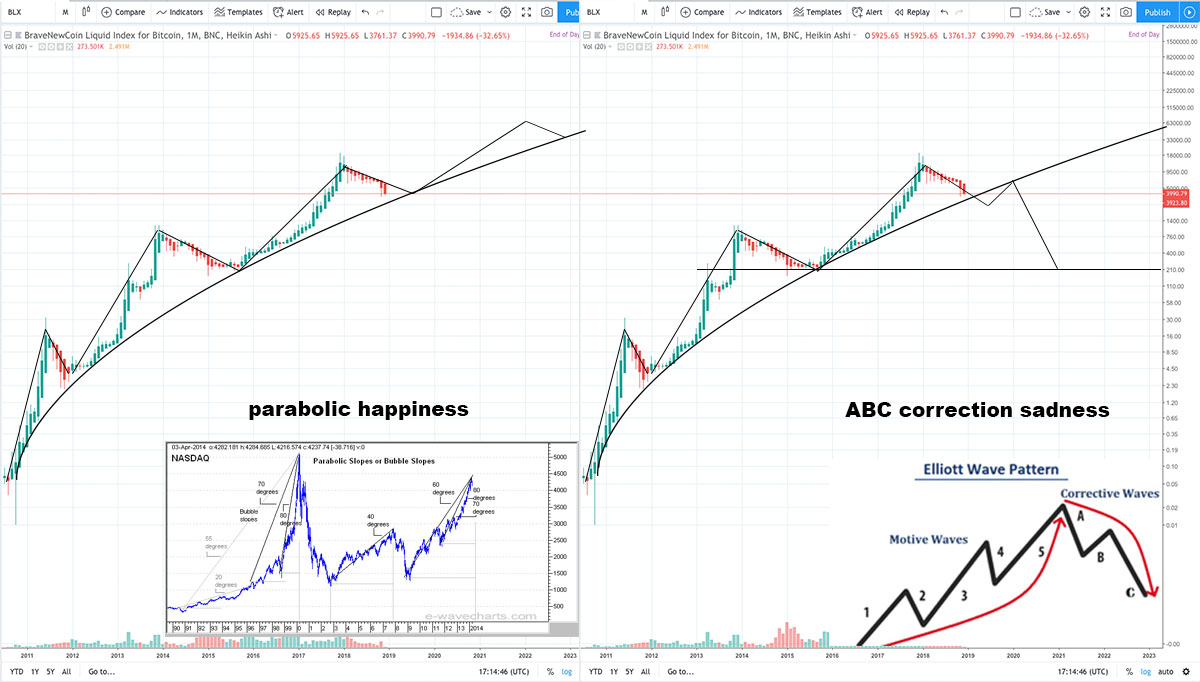
No one knows if Bitcoin will go back up or not. However, historically Bitcoin has been subject to a number of booms and busts and recovered to from new highs each time. The same is generally true for most altcoins that stood the test of time, although some never reclaimed their all time highs.
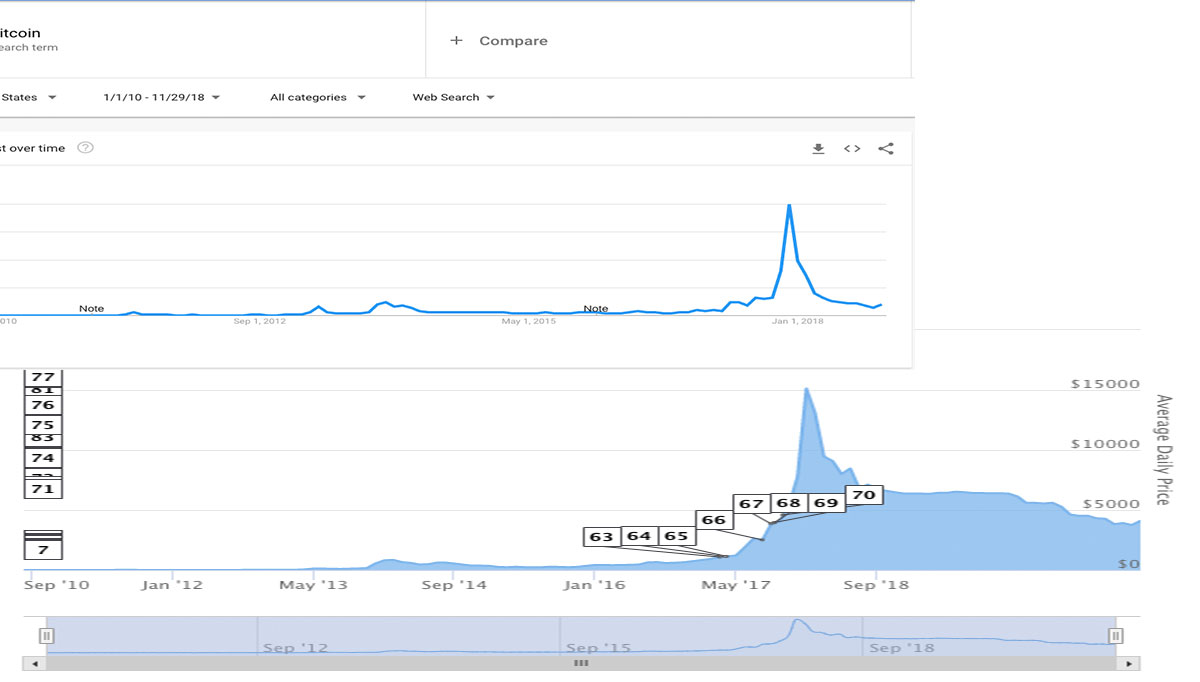
Bitcoin is finally trending up in Google Trends after being stuck at a low for most of 2018. In general the price of Bitcoin has directly correlated with Google trends.
BTC has a favorable setup in terms of many moving averages and more. For example, the MACD is gearing up to cross on the daily, and we already have crosses of key averages on lower time frames.
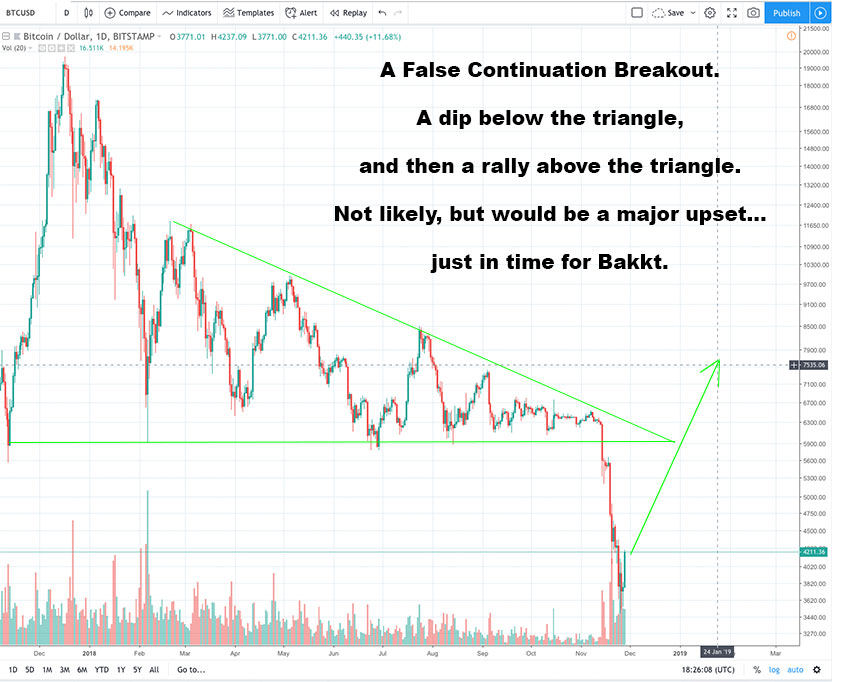
The 2018 triangle broke down Nov 19th and it resulted in a 50% drop for BTC. There is however a possibility that this will end up being a false breakdown. Let’s look what a “False Continuation Breakout” pattern would look like in BTC.
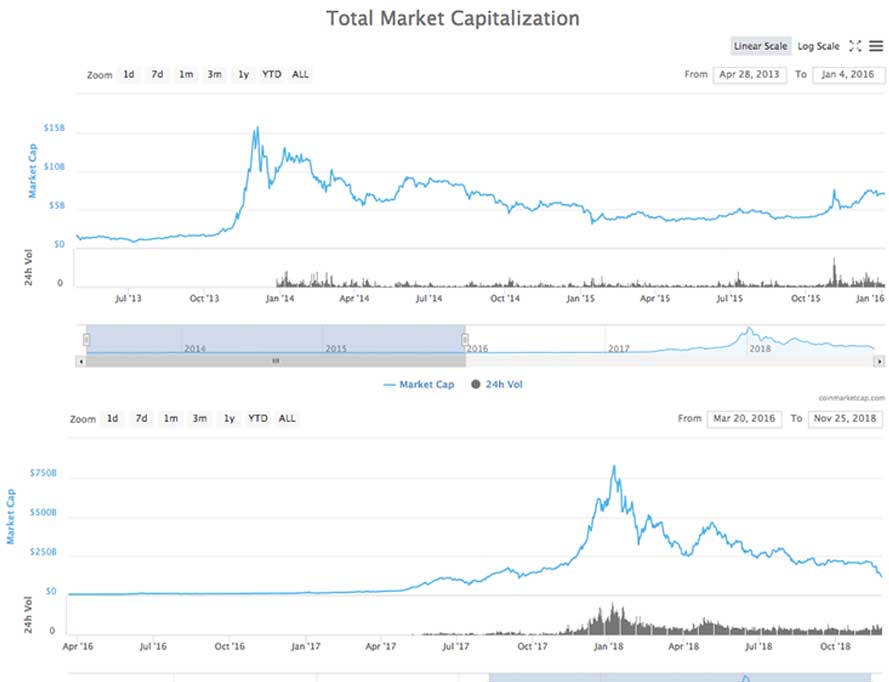
The decline in the total market cap of all crypto in 2018 from peak to low is actually bigger than in 2014. Not just in dollar amount, but in the percentage dropped.
If you bought the top of the 2017 – 2018 crypto market, you could be down 80% – 99.9% depending on what you bought. That is rough, but you have options.
By continuing to use the site, you agree to the use of cookies. more information
The cookie settings on this website are set to "allow cookies" to give you the best browsing experience possible. If you continue to use this website without changing your cookie settings or you click "Accept" below then you are consenting to this.